
Description
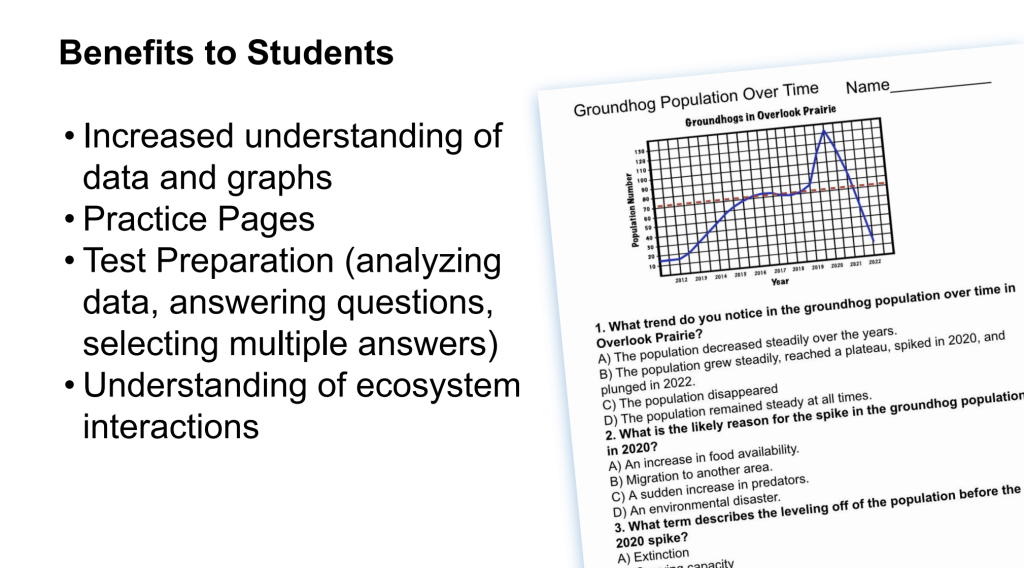
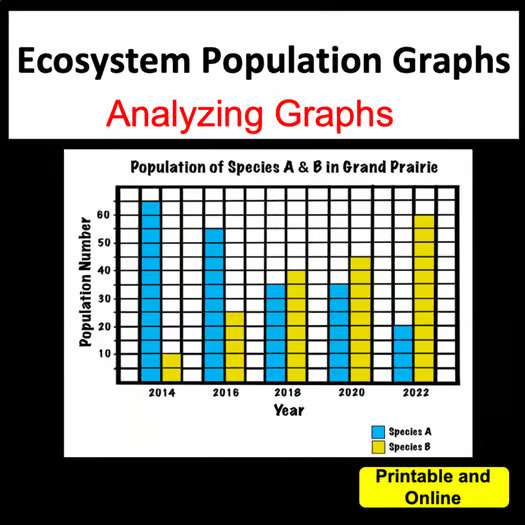
Do your students need to practice analyzing graphs and data? Would you like them to learn about ecosystem population graphs and what they mean? In this unit, students will be introduced to ecosystem graphs and terms like carrying capacity, limiting factors, and predator-prey cycles. They will practice analyzing graphs with 15 graph pages. PDF and (Google™ forms)
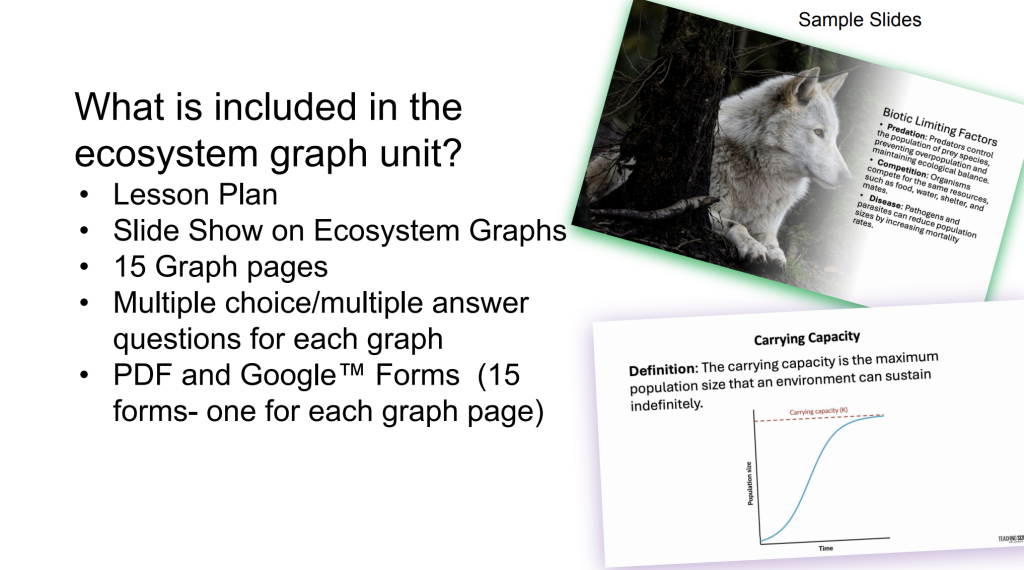
What does this ecosystem graph unit include?
- Lesson plan
- Slide show (PPT and Google™ Slides)
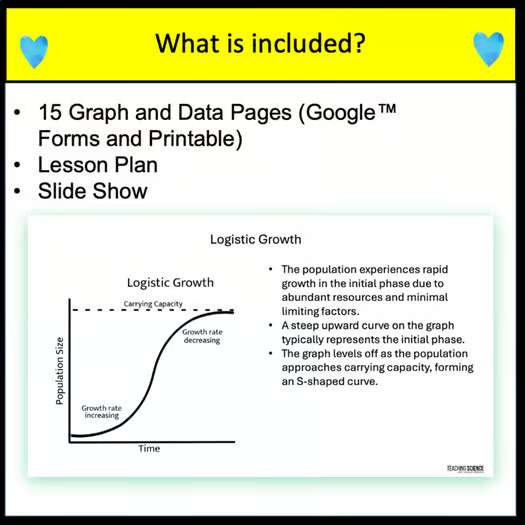
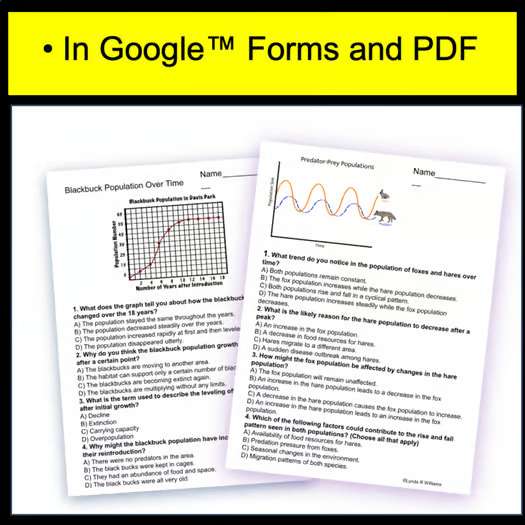
- 15 graph pages (PDF and Google™ Forms)
- Multiple-choice and multiple-answer questions
- Answer Keys
The graph pages can be used as a printable worksheet as a self-checking Google™ form.
There are 15 Google™ forms, so they can each be used separately.
They do not need to be used in a specific order.
- Use as a review.
- Use as an independent practice.
- Use as a bell ringer
The slide show introduces students to:
- Carrying capacity
- Biotic limiting factors
- Abiotic limiting factors
- Logistic growth and exponential growth
You will love this resource!