
Description
Bring Claim–Evidence–Reasoning (CER) writing to life in your classroom with these ready-to-use graph-based science activities! Explicitly designed for 5th-grade life science, this resource helps students strengthen data analysis skills, practice scientific writing, and connect real-world science concepts to visual evidence.
Students will analyze 16 engaging graphs covering key life science topics: body systems, ecosystems, adaptations, pollination, invasive species, life cycles, trait variation, and human impact on the environment. Each graph includes:
A student-friendly scenario
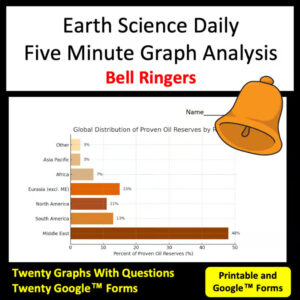
A clear graph or data display
A CER writing prompt (Claim, Evidence, Reasoning)
A sample student response to model expectations
Teachers get:
Printable student pages for writing practice
Google Slides version for digital classrooms
A teacher’s slideshow of graphs for projection and discussion
A student-friendly CER rubric
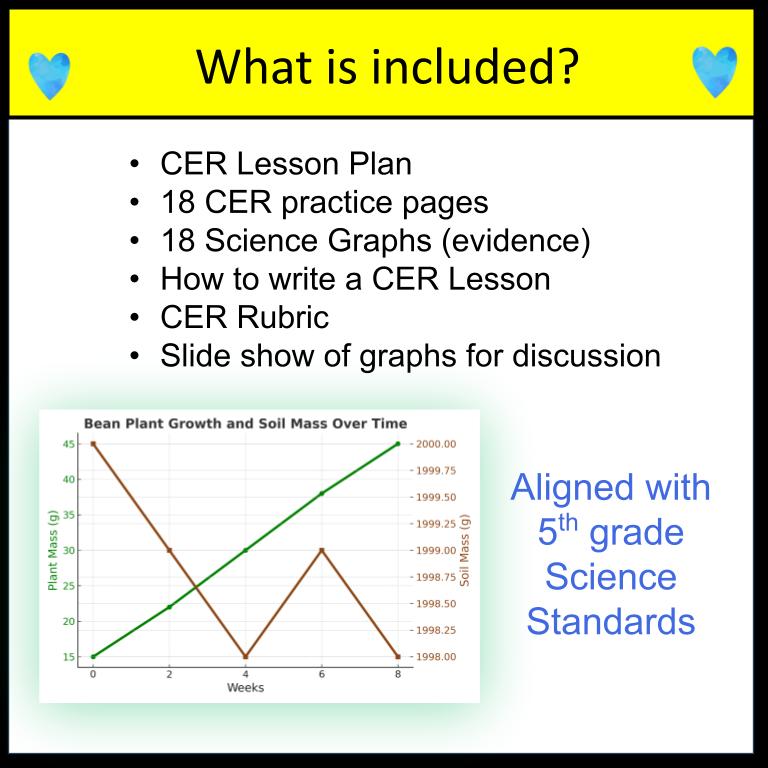
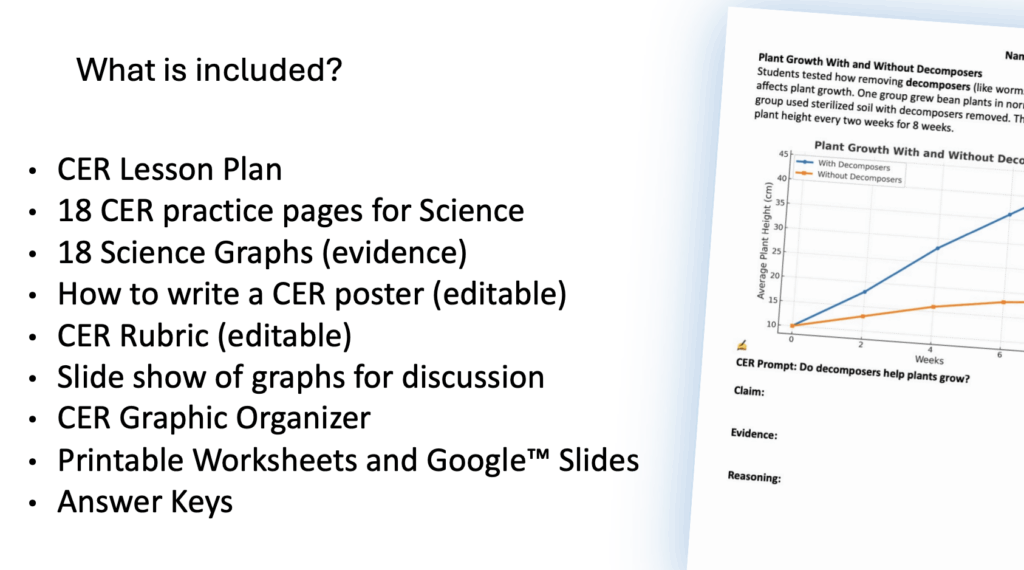
What’s included?
✔ 16 life science graphs with prompts & scenarios ( 2 bonus graphs with different graph formats)
✔ Printable + Google Slides formats
✔ Editable rubric and checklist for CER writing
✔ Teacher slideshow of graphs (no text, easy to project)
✔ Aligned to NGSS 5th Grade Life Science and multiple state standards (NC, SC, OH, KY, IN, AZ)
Alignment to 5th-grade Science Standards
Body Systems Working Together During Exercise
NC: LS.5.1.2 | NGSS: 4-LS1-1 | AZ: 5.L2U1.11 | SC: 5.L.3A.1 | OH: 5.LS.1 | KY/IN: NGSS-aligned
Plant Growth With and Without Decomposers
NC: LS.5.2.3 | NGSS: 5-LS2-1 | AZ: 5.L2U1.10 | SC: 5.L.4B.2 | OH: 5.LS.2 | KY/IN: NGSS-aligned
Seed Production With and Without Pollinators
NC: LS.5.3.2 | NGSS: 3-LS1-1 | AZ: 5.L3U1.9 | SC: 5.L.4A.2 | OH: 5.LS.1 | KY/IN: NGSS-aligned
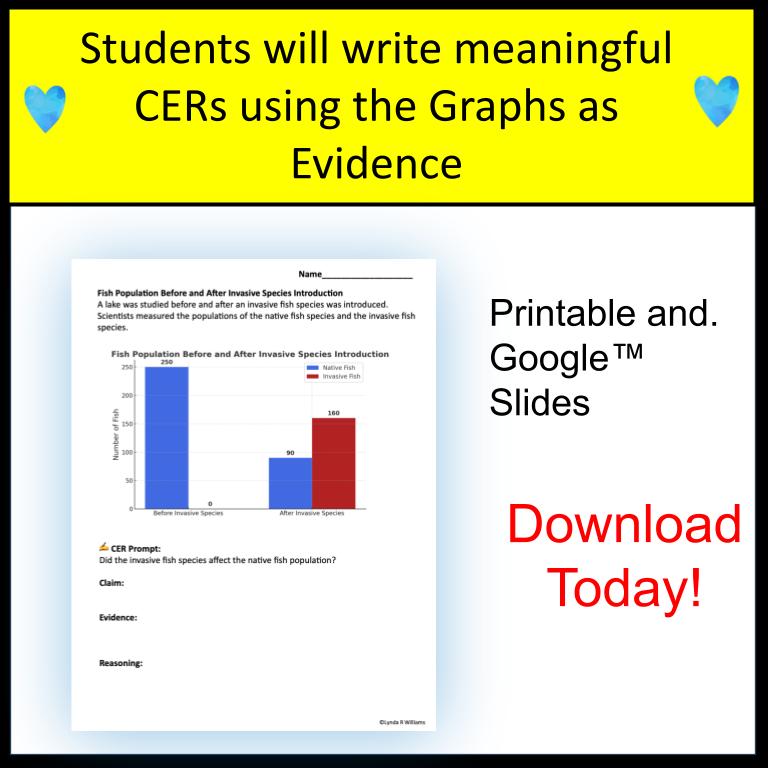
Fish Population Before and After Invasive Species
NC: LS.5.2.3 | NGSS: 5-LS2-1 | AZ: 5.L4U3.11 | SC: 5.L.4B.2 | OH: 5.LS.2 | KY/IN: NGSS-aligned
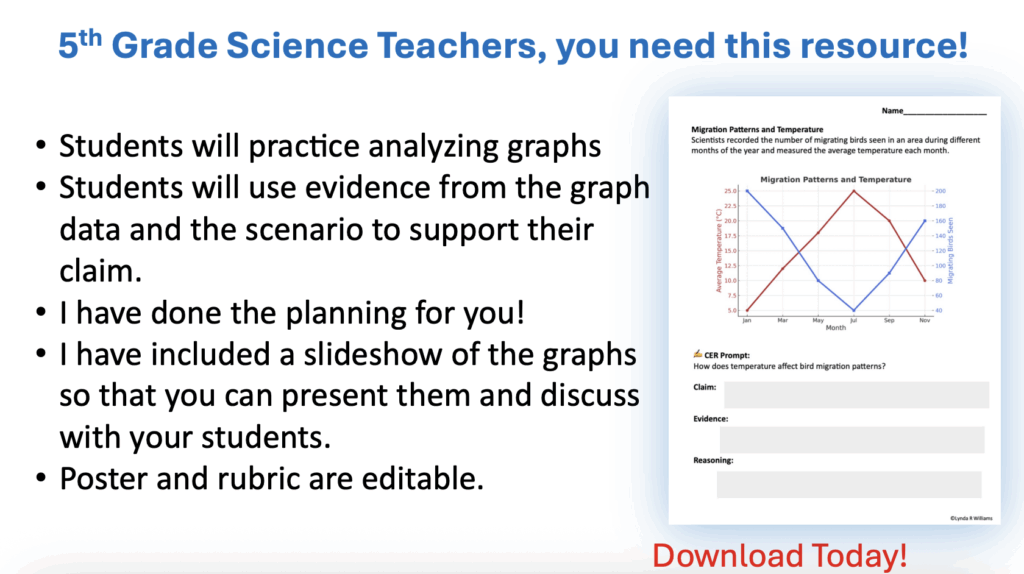
Migration Patterns and Temperature
NC: LS.5.3.1 | NGSS: 3-LS1-1 | AZ: 5.L3U1.9 | SC: 5.L.4A.1 | OH: 5.LS.1 | KY/IN: NGSS-aligned
Tree Growth Rings and Rainfall
NC: LS.5.2.3 | NGSS: 5-LS2-1 | AZ: 5.L2U1.10 | SC: 5.L.4B.2 | OH: 5.LS.2 | KY/IN: NGSS-aligned
Energy Flow in an Ecosystem
NC: LS.5.2.2 | NGSS: 5-LS2-1 | AZ: 5.L4U3.11 | SC: 5.L.4B.1 | OH: 5.LS.2 | KY/IN: NGSS-aligned
Plant Growth with Freshwater vs. Saltwater
NC: LS.5.2.3 | NGSS: 5-LS2-1 | AZ: 5.L2U1.10 | SC: 5.L.4B.2 | OH: 5.LS.2 | KY/IN: NGSS-aligned
Camouflage and Predator Success
NC: LS.5.3.2 | NGSS: 3-LS4-2 | AZ: 5.L3U1.9 | SC: 5.L.4A.2 | OH: 5.LS.1 | KY/IN: NGSS-aligned
Predator-Prey Population Changes
NC: LS.5.2.3 | NGSS: 5-LS2-1 | AZ: 5.L4U3.11 | SC: 5.L.4B.2 | OH: 5.LS.2 | KY/IN: NGSS-aligned
Classifying Organisms by Shared Traits
NC: LS.5.2.2 | NGSS: 3-LS3-1 | AZ: 5.L4U1.9 | SC: 5.L.4A.1 | OH: 5.LS.1 | KY/IN: NGSS-aligned
Habitat Loss and Population Decline
NC: LS.5.2.3 | NGSS: 5-LS2-1 | AZ: 5.L4U3.11 | SC: 5.L.4B.2 | OH: 5.LS.2 | KY/IN: NGSS-aligned
Bean Plant Growth and Soil Mass Over Time
NC: LS.5.1.1 | NGSS: 5-LS1-1 | AZ: 5.L2U1.10 | SC: 5.L.1A.1 | OH: 5.LS.1 | KY/IN: NGSS-aligned
Life Cycle Lengths of Different Organisms
NGSS: 3-LS1-1 | AZ: 5.L3U1.9 | SC: 5.L.4A.3 | OH: 5.LS.1 | KY/IN: NGSS-aligned
Trait Variation and Survival
NGSS: 3-LS4-2 | AZ: 5.L3U1.9 | SC: 5.L.4A.2 | OH: 5.LS.1 | KY/IN: NGSS-aligned
Environmental Change and Species Recovery
NGSS: 3-LS4-4 | AZ: 5.L4U3.11 | SC: 5.L.4B.2 | OH: 5.LS.2 | KY/IN: NGSS-aligned
Why teachers love it:
✅ No-prep, ready-to-use activities
✅ Builds essential graph interpretation skills
✅ Supports test prep with real data analysis practice
✅ Encourages higher-level thinking through CER writing
Note to Teacher
You will notice that two topics (Habitat Loss and Body Systems During Exercise) each appear in two different graph formats. These variations are intentional.
Habitat Loss: One graph shows population decline over time (line graph), while the other compares population size across different levels of habitat loss (bar graph).
Body Systems During Exercise: One graph shows changes over 20 minutes of exercise (line graph), while the other provides a snapshot after a short burst of exercise (bar graph).
Including both versions allows students to practice interpreting different types of graphs while exploring similar scientific concepts. This strengthens data analysis skills, supports CER writing, and highlights how the same idea can be represented in multiple ways.
In other words, there are 18 graphs altogether, but 16 topics.
Check out my blog post on helping students master CER with graph based practice!