

Description
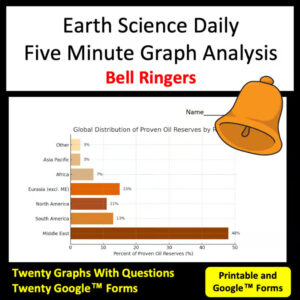
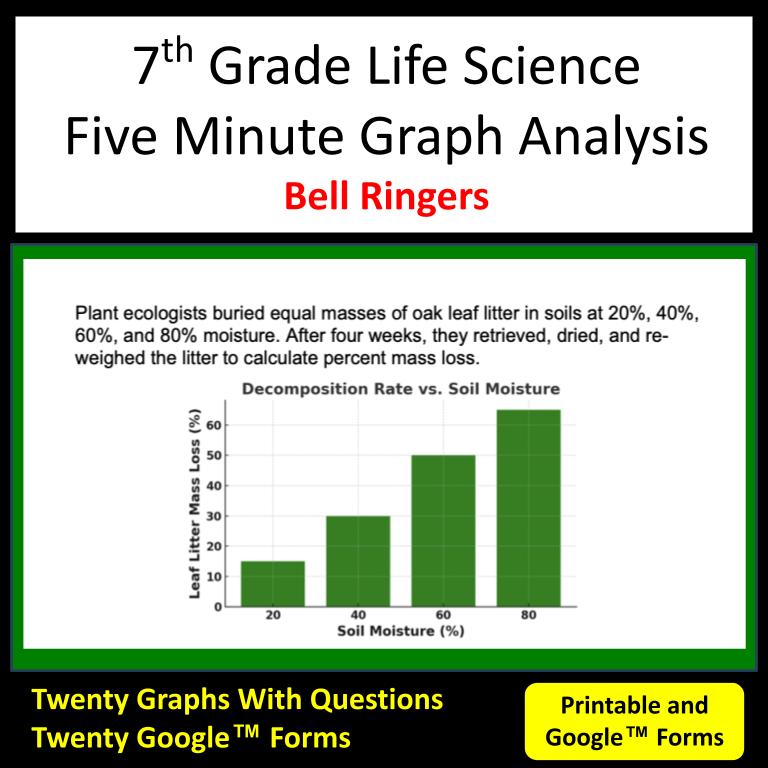
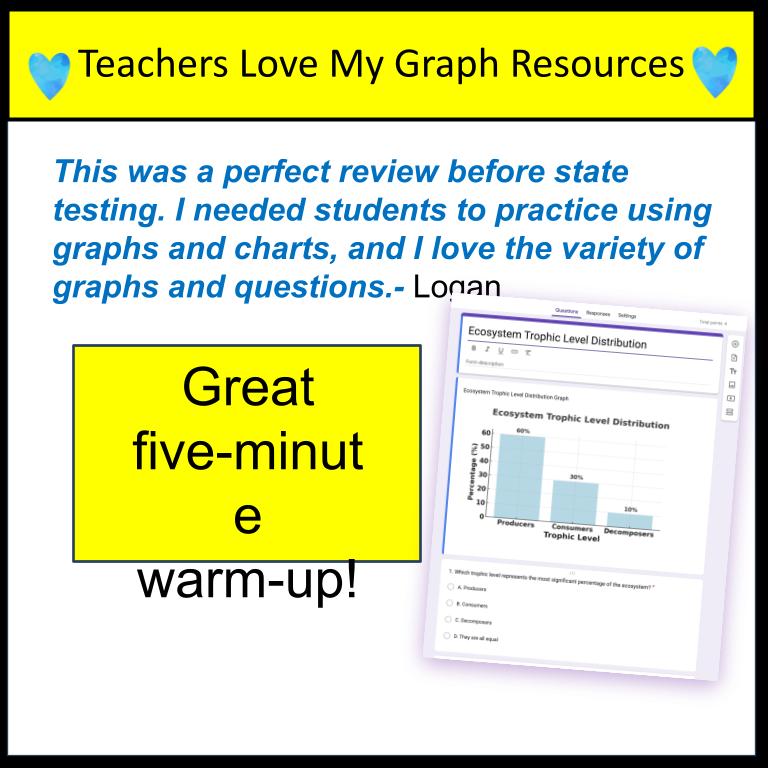
Do you want a daily graph practice that takes 5 minutes? These bell ringers and warm-ups are just what you need! Give your 7th Grade scientists a quick, engaging way to sharpen their data‑analysis skills without adding to your grading pile! This is a ready‑to‑go bellringer resource. Just Five Minutes to Focus Your Students and Practice Analyzing Graphs.
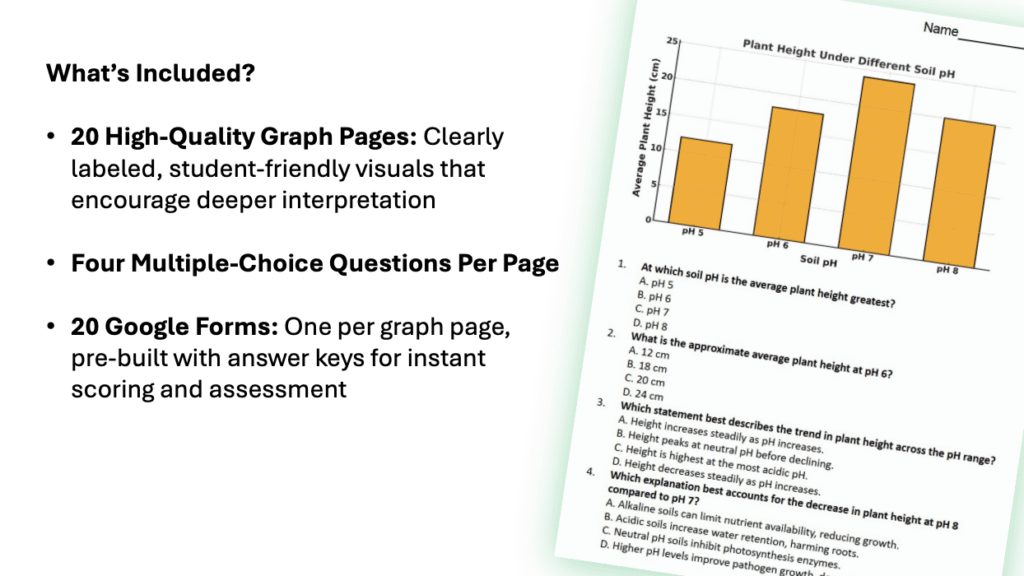
What’s Included?
•20 High‑Quality Graph Pages: Clearly labeled, student‑friendly visuals that encourage deeper interpretation
•Four Multiple-Choice Questions Per Page
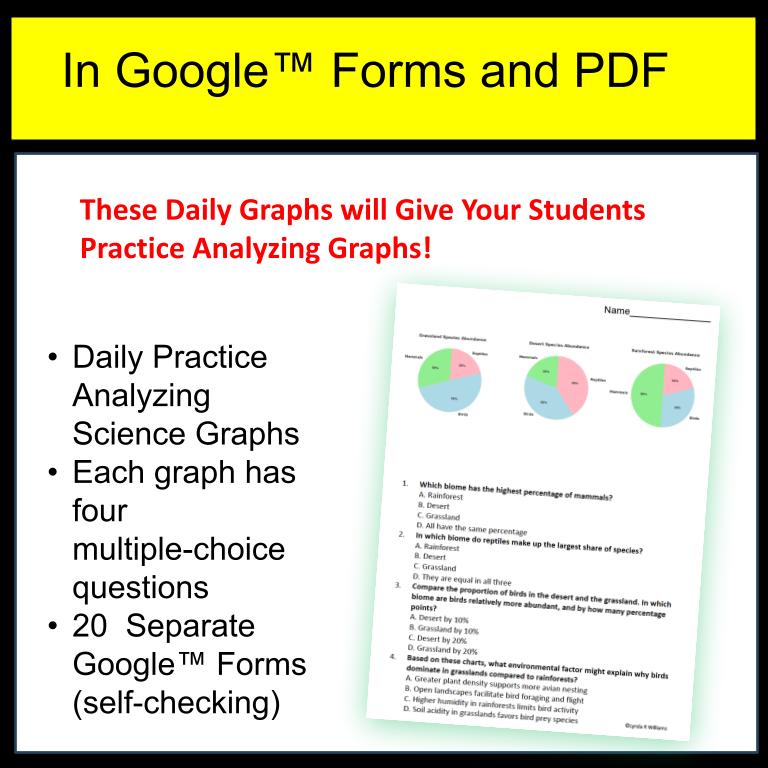
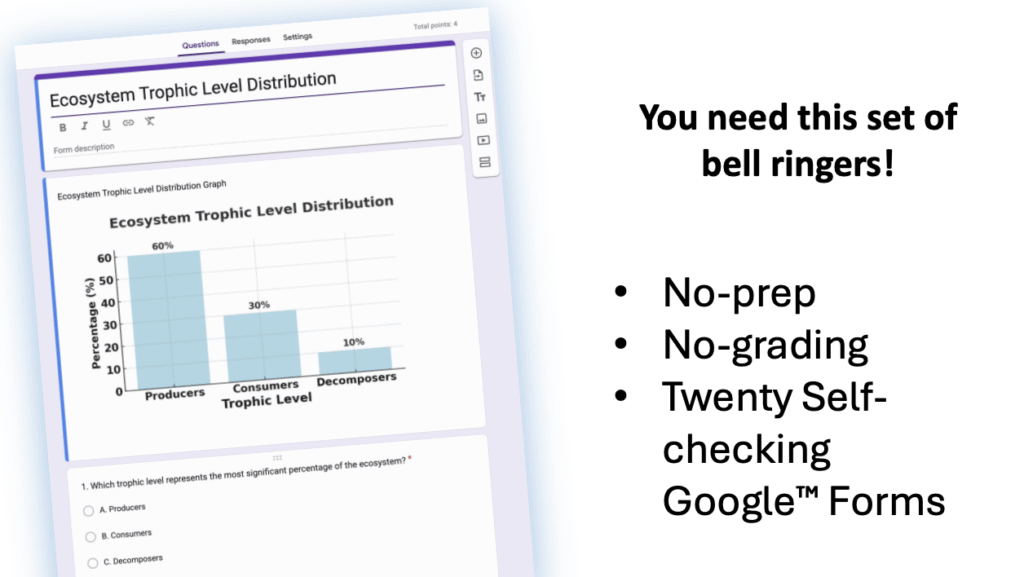
•20 Google Forms: One per graph page, pre‑built with answer keys for instant scoring and assessment
Why Teachers Love It
- Time‑Saver: Spend minutes at the start of class—students dive straight into meaningful analysis.
- Data‑Driven Practice: Reinforces graph‑reading skills and scientific reasoning every day.
- Students practice using the SEP Analyzing Data.
- Student Engagement: Fresh topics keep learners curious and discussions lively.
Empower your students to think like scientists—one graph at a time!
Life Science Bell Ringers – Graphs & NGSS Alignment
- Predator–Prey Population Cycles → MS-LS2-1, MS-LS2-2
- Enzyme Activity vs Temperature → MS-LS1-2
- Photosynthesis Rate vs Light Intensity → MS-LS1-6
- Annual Sea Urchin Density and Kelp Coverage → MS-LS2-2, MS-LS2-4
- Cellular Respiration vs Glucose Concentration → MS-LS1-7
- Pollinator Visits by Flower Color → MS-LS2-2, MS-LS2-4
- Seed Germination vs Water Volume → MS-LS1-5
- Plant Height Under Different Soil pH → MS-LS1-5
- Peppered Moth Frequency (Pre- and Post-Industrialization) → MS-LS4-4, MS-LS4-6
- Biome Species Abundance → MS-LS2-1, MS-LS2-2
- Trophic Level Biomass Distribution → MS-LS2-3
- Stomatal Density vs Leaf Surface Position → MS-LS1-3
- Radish Seed Germination vs Salinity → MS-LS1-5
- Heart Rate vs Exercise Time → MS-LS1-3
- Decomposition Rate vs Soil Moisture → MS-LS2-3
- Chlorophyll a & Oxygen Release vs Nitrate Levels → MS-LS2-3, MS-LS2-4
- Biomass Distribution in Meadow Food Web → MS-LS2-3
- Aquatic Invertebrate Density vs pH → MS-LS2-4
- Bean/Sunflower Growth With vs Without Sunlight → MS-LS1-6
- Ecosystem Trophic Level Distribution → MS-LS2-3
Just Five Minutes to Focus Your Students and Practice Analyzing Graphs
Check out my blog post on helping students master CER with graph based practice!