
Description
Make science spooky, engaging, and skill-building this October with these Halloween Science Graph Activities! This set includes 16 graph pages with fun, seasonal data that gets students practicing essential graph interpretation skills. From monster heights to trick-or-treat walking distances, students will analyze data, answer multiple-choice questions, and build confidence in science practices.
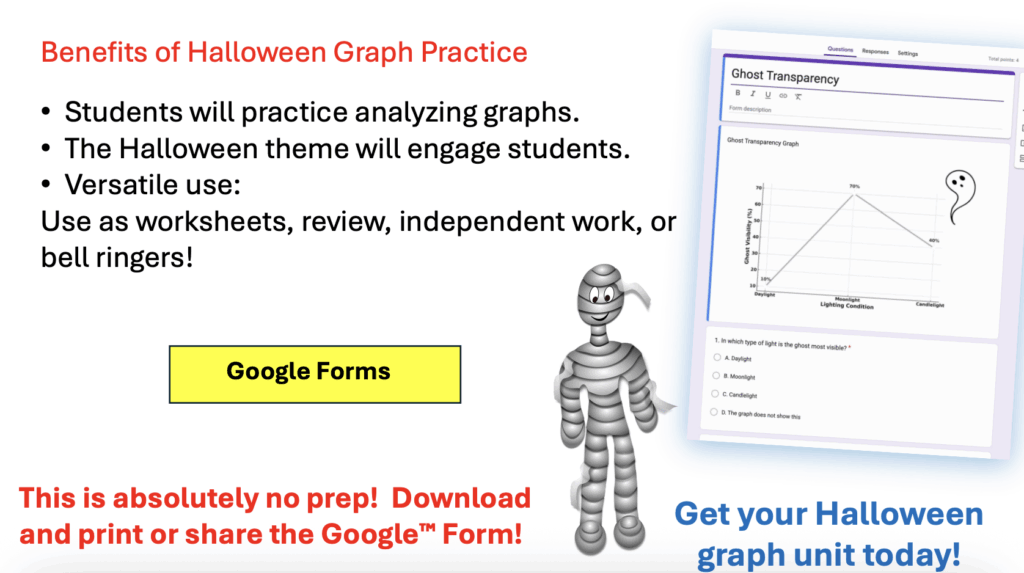
Perfect for bell ringers, sub plans, early finishers, or quick reviews, these activities are designed to be both print-ready and available in self-checking Google Forms. This provides you with maximum flexibility in the classroom.
Aligned to NGSS Science and Engineering Practices (Analyzing and Interpreting Data), these Halloween science graphs provide meaningful practice while keeping students engaged with festive themes.
What’s Included
- 16 Halloween graph pages (line, bar, and more)
- Multiple-choice questions with answer keys
- Printable PDF for classroom use
- Self-checking Google™ Forms version
- Seasonal themes like monsters, haunted houses, spider silk, dragon roars, trick-or-treating, and more (but still sciencey)
Ways to Use
- Daily bell ringers or warm-ups in October
- Quick formative assessments
- Homework or digital assignments
- Sub plans that are ready to go
- Fun practice before Halloween
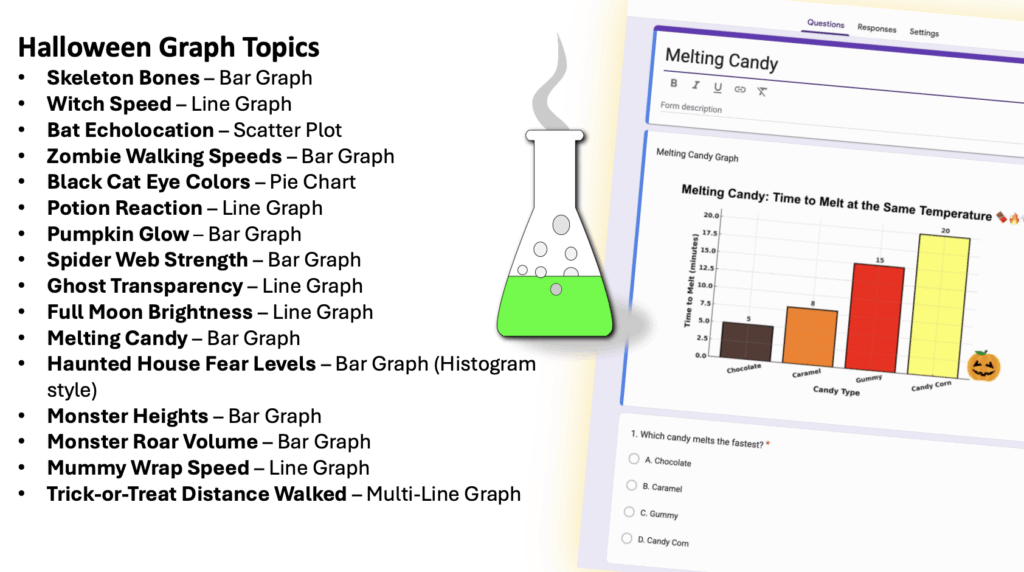
📊 Halloween Graphs List
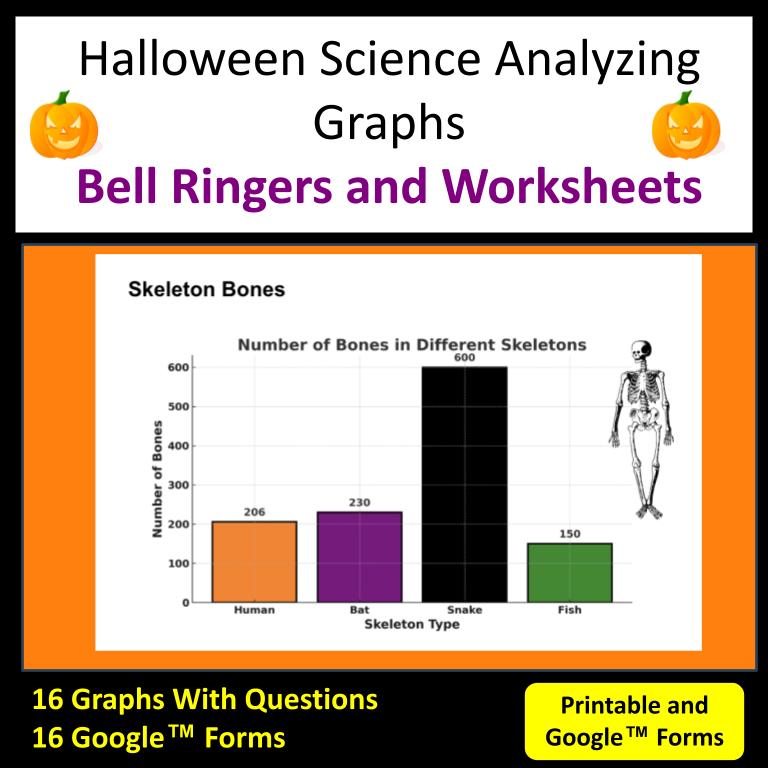
- Skeleton Bones – Bar Graph – Life science: anatomy (human, bat, snake, fish bone counts)
- Witch Speed – Line Graph – Physical science: motion (distance vs. time for two witches)
- Bat Echolocation – Scatter Plot – Sound waves & adaptations (frequency vs. distance detected)
- Zombie Walking Speeds – Bar Graph – Motion & rates (zombies, humans, dogs, cheetahs)
- Black Cat Eye Colors – Pie Chart – Traits & variation (distribution of eye colors)
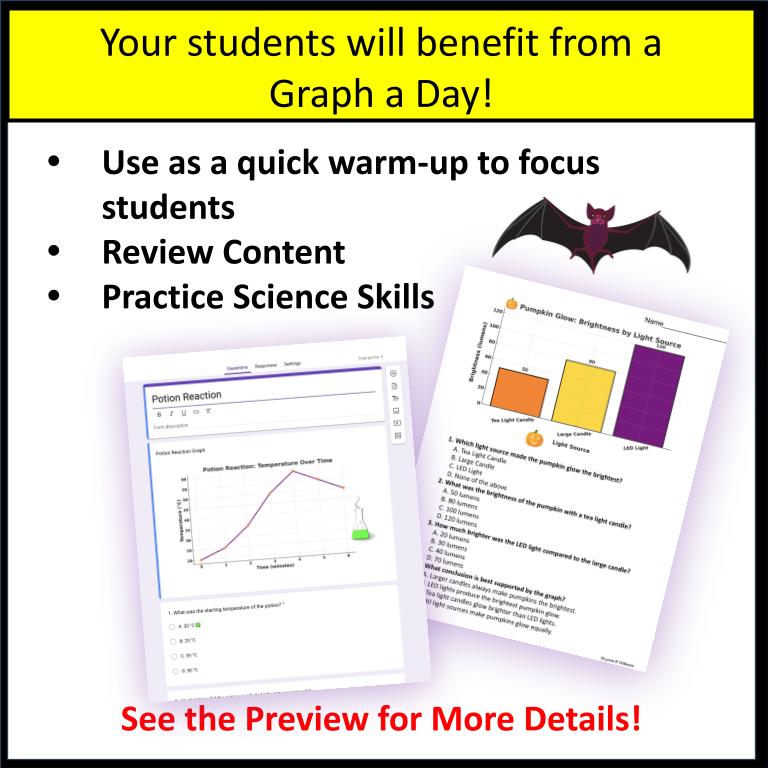
- Potion Reaction – Line Graph – Chemical reactions (temperature change over time, exothermic)
- Pumpkin Glow – Bar Graph – Energy & light (jack-o’-lantern brightness with different light sources)
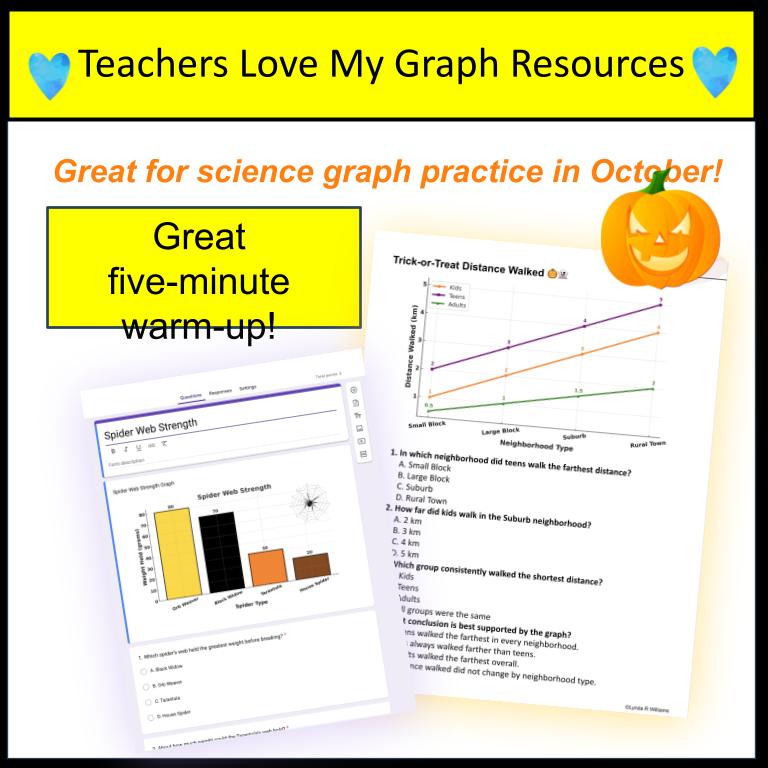
- Spider Web Strength – Bar Graph – Engineering in nature (weight held by different spider webs)
- Ghost Transparency – Line Graph – Light & transparency (visibility under daylight, moonlight, candlelight)
- Full Moon Brightness – Line Graph – Astronomy (relative brightness across lunar phases)
- Melting Candy – Bar Graph – States of matter & heat transfer (time to melt chocolate, caramel, gummy, candy corn)
- Haunted House Fear Levels – Bar Graph (Histogram) – Data collection & survey results (visitor scare levels)
- Monster Heights – Bar Graph – Data comparison (Frankenstein, Vampire, Werewolf, Mummy)
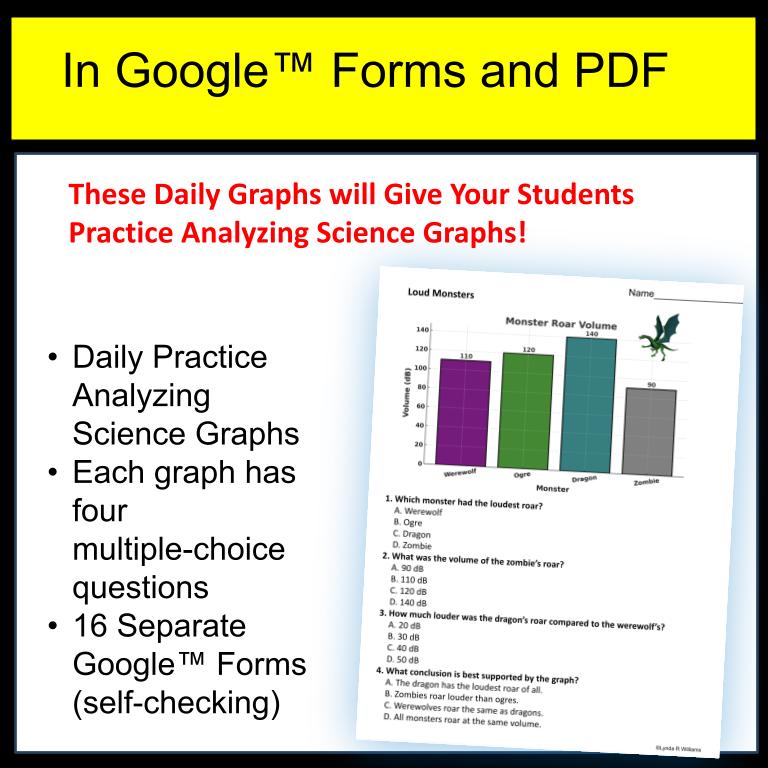
- Monster Roar Volume – Bar Graph – Sound & energy (roar loudness of creatures)
- Mummy Wrap Speed – Line Graph – Rates & comparisons (time to wrap by child, teen, adult, pro)
- Trick-or-Treat Distance Walked – Multi-Line Graph – Motion & measurement (kids, teens, adults across neighborhoods)
- All 16 activities are tightly tied to NGSS Science & Engineering Practice: Analyzing & Interpreting Data. Many also connect to Developing & Using Models, Constructing Explanations, and Using Mathematics.
Check out my blog post on helping students master CER with graph based practice!