


Description
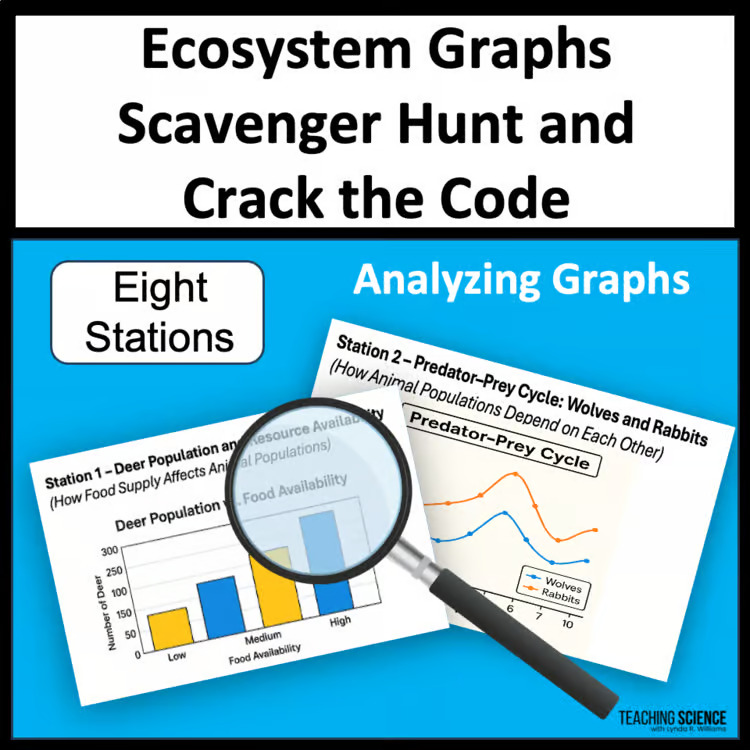
Turn graph interpretation into a fun challenge with this Ecosystem Graphs Crack-the-Code Scavenger Hunt! Students rotate through eight printable graph stations to analyze real-world ecosystem data and uncover a secret science word.
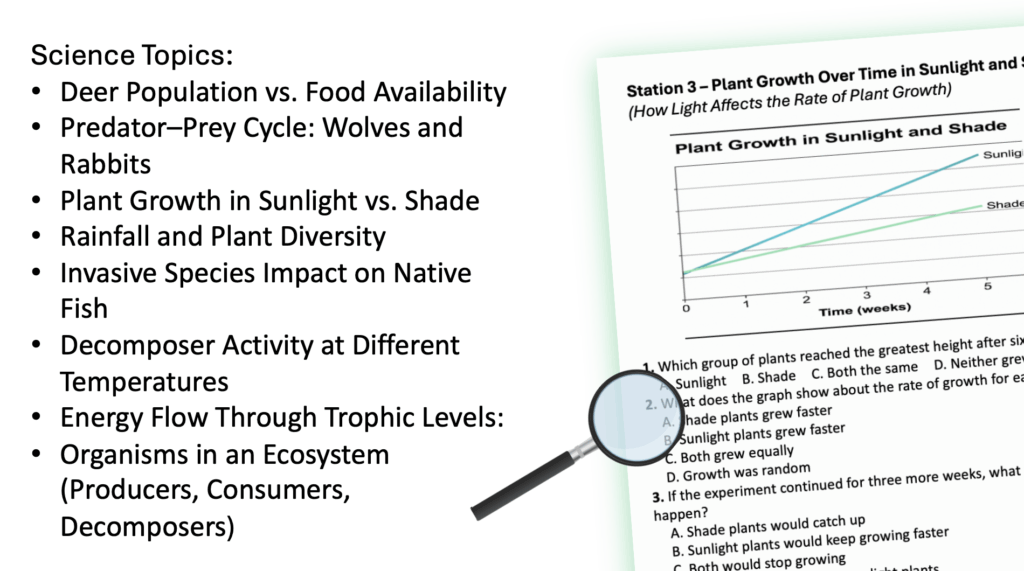
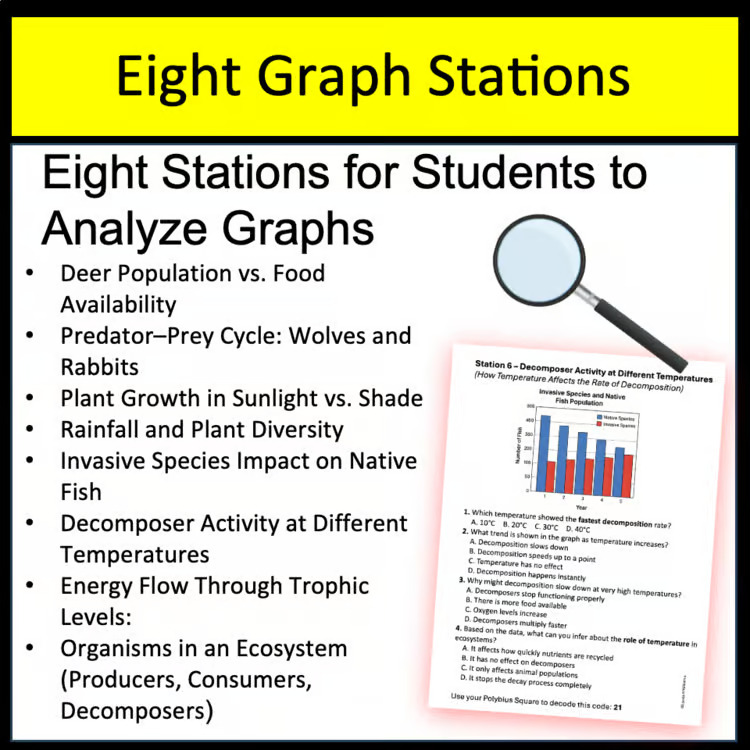
Each station includes a graph, multiple-choice questions, and a code to decode using a Polybius Square. Students interpret data, identify cause-and-effect relationships, and connect patterns to energy flow and survival in ecosystems.
Graph Topics Included:
1️⃣ Deer Population vs. Food Availability
2️⃣ Predator–Prey Cycle: Wolves and Rabbits
3️⃣ Plant Growth in Sunlight vs. Shade
4️⃣ Rainfall and Plant Diversity
5️⃣ Invasive Species Impact on Native Fish
6️⃣ Decomposer Activity at Different Temperatures
7️⃣ Energy Flow Through Trophic Levels
8️⃣ Organisms in an Ecosystem (Producers, Consumers, Decomposers)
Aligned to NGSS 5-LS2-1, MS-LS2-1, MS-LS2-3, and MS-LS2-4, this printable science game reinforces graph analysis, data interpretation, and ecosystem relationships.
✅ Perfect for 5th–7th Grade
✅ Includes Student Recording Sheet & Teacher Key
✅ Great for Stations, Review Days, or Substitute Plans