
Description
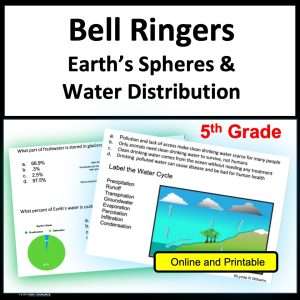
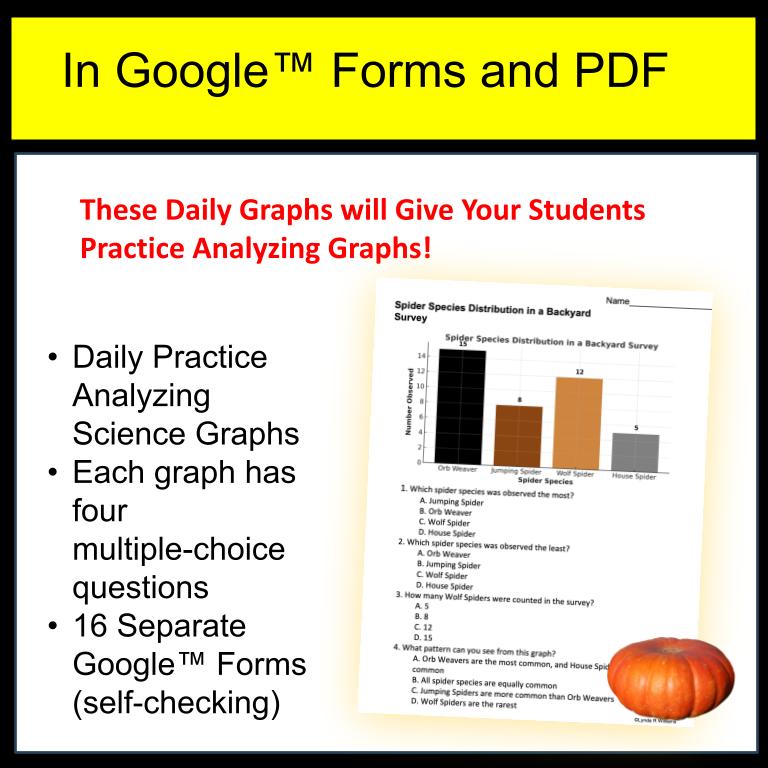
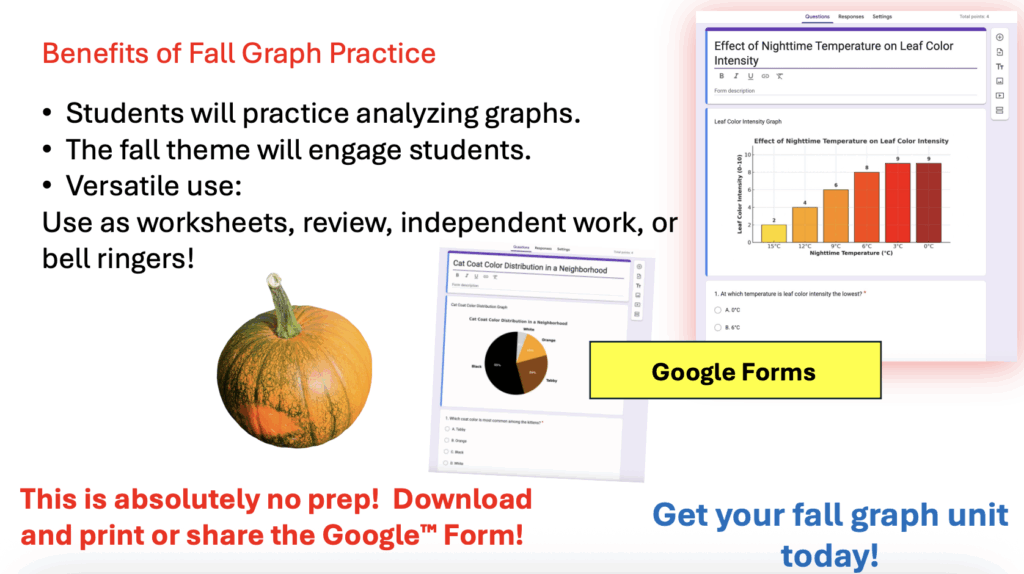
Bring the season of pumpkins, leaves, and migration into your classroom with this engaging fall-themed set of science worksheets and bellringers. Students will practice the Science and Engineering Practice of analyzing and interpreting data while exploring 16 unique graphs connected to real fall phenomena. Each activity comes with a matching self-checking Google Form, making it easy for teachers and fun for students — with no grading required. Have your students analyze graphs in just five minutes a day!
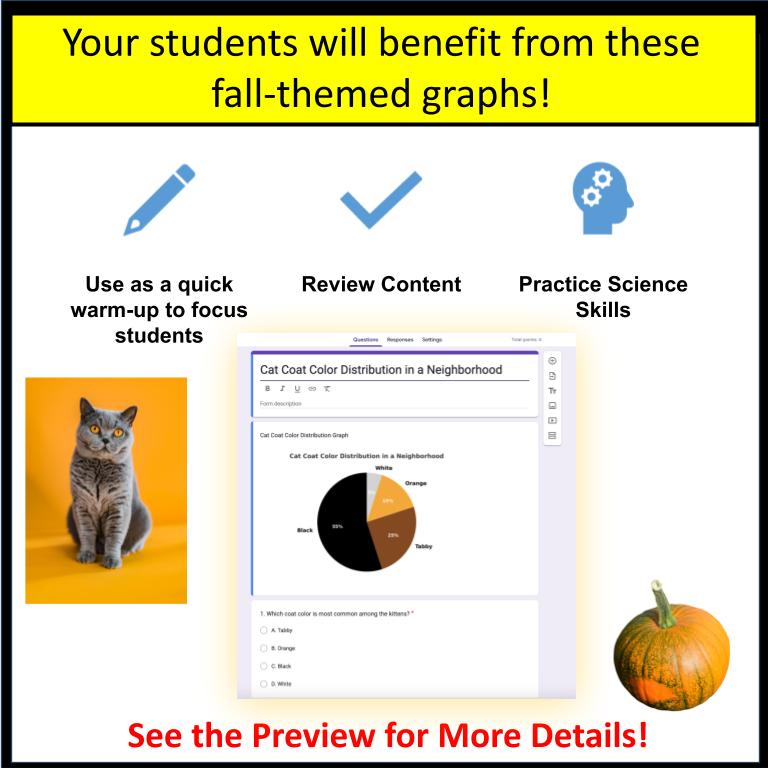
This resource is perfect for daily warm-ups, exit tickets, sub plans, or extra practice. Every page is designed to help students strengthen graphing and data analysis skills while connecting science to the world around them.
What’s Included
• 16 fall science worksheets with graph analysis questions
• 16 matching Google Forms (auto-graded)
• 4 Multiple-choice questions for each graph
• Answer keys for every activity
• Seasonal topics such as pumpkins, leaves, migration, frost dates, and more
Skills and Standards
• Students practice analyzing and interpreting graphs
• Builds data literacy and critical thinking
• Supports NGSS Science and Engineering Practices
Graphs Included
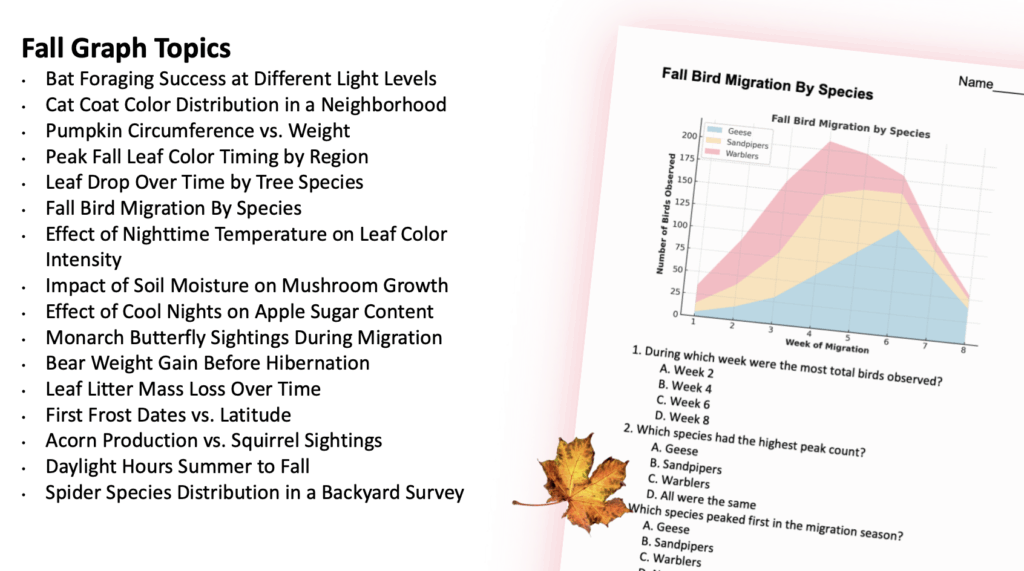
- Bat Foraging Success at Different Light Levels – Bar Graph
- Cat Coat Color Distribution in a Neighborhood – Pie Chart
- Pumpkin Circumference vs. Weight – Scatter Plot
- Peak Fall Leaf Color Timing by Region – Bar Graph
- Leaf Drop Over Time by Tree Species – Line Graph
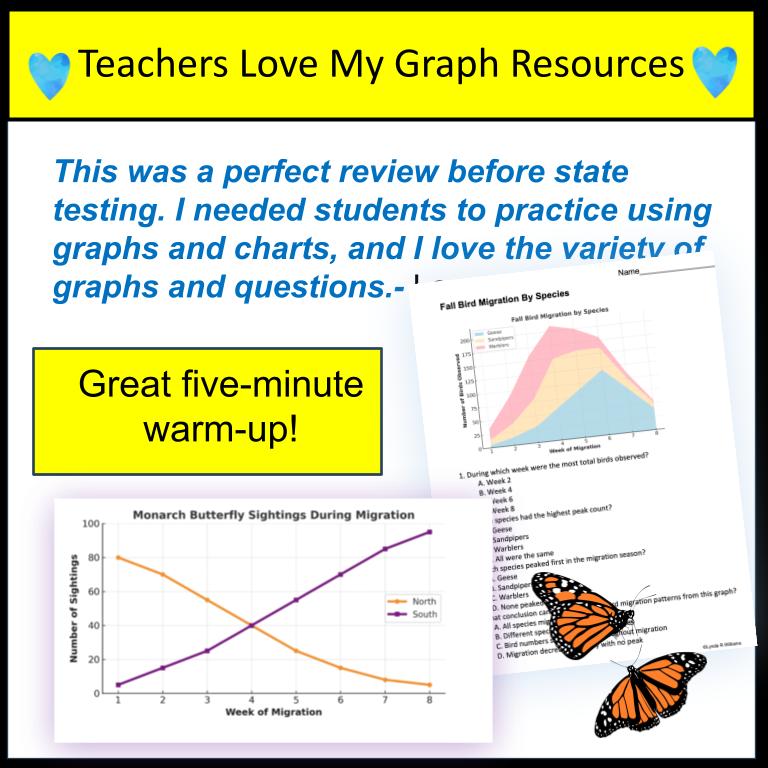
- Fall Bird Migration by Species – Line Graph
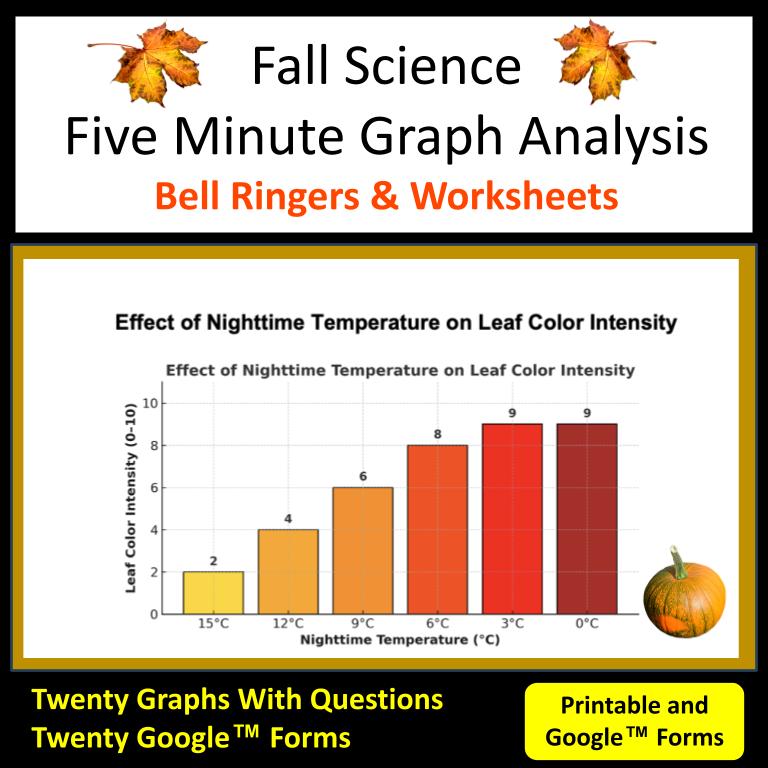
- Effect of Nighttime Temperature on Leaf Color Intensity – Line Graph
- Effect of Soil Moisture on Mushroom Growth – Bar Graph
- Effect of Cool Nights on Apple Sugar Content – Line Graph
- Monarch Butterfly Sightings During Migration – Line Graph
- Bear Weight Gain Before Hibernation – Line Graph
- Leaf Litter Mass Loss Over Time – Line Graph
- First Frost Dates vs. Latitude – Bar Graph
- Acorn Production vs. Squirrel Sightings – Line Graph
- Daylight Hours Summer to Fall – Line Graph
- Spider Species Distribution in a Backyard Survey – Bar Graph
Why Teachers Love It
• No grading with self-checking Google Forms
• Perfect for bellringers, warmups, or quick review
• Engaging fall themes keep students interested
• Ready-to-use print and digital formats
Make fall science both meaningful and manageable with graph-based bellringers that require no extra prep and no grading, just seasonal science practice that builds data skills every day.
Check out my blog post on helping students master CER with graph based practice!