


Description
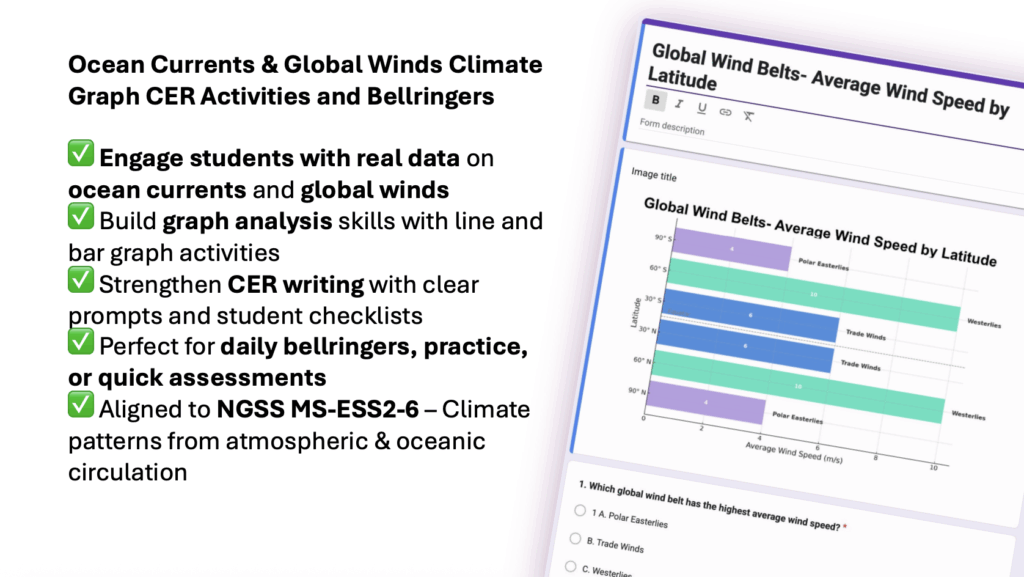
Engage students with ocean currents and global winds graph activities that build science skills and strengthen CER writing. Perfect for bellringers, practice, or assessment prep, aligned to NGSS MS-ESS2-6.
Give your middle school students the tools they need to analyze real-world data on ocean currents and global winds while practicing critical thinking with CER activities. This resource is designed to align with NGSS MS-ESS2-6, helping students explore how unequal heating and Earth’s rotation drive patterns of atmospheric and oceanic circulation that shape regional climates.
Students will build confidence in graph interpretation, data analysis, and Claim-Evidence-Reasoning writing as they engage with multiple graph-based activities and quick daily bellringers. Perfect for reinforcing Earth science concepts and building science and engineering practices.
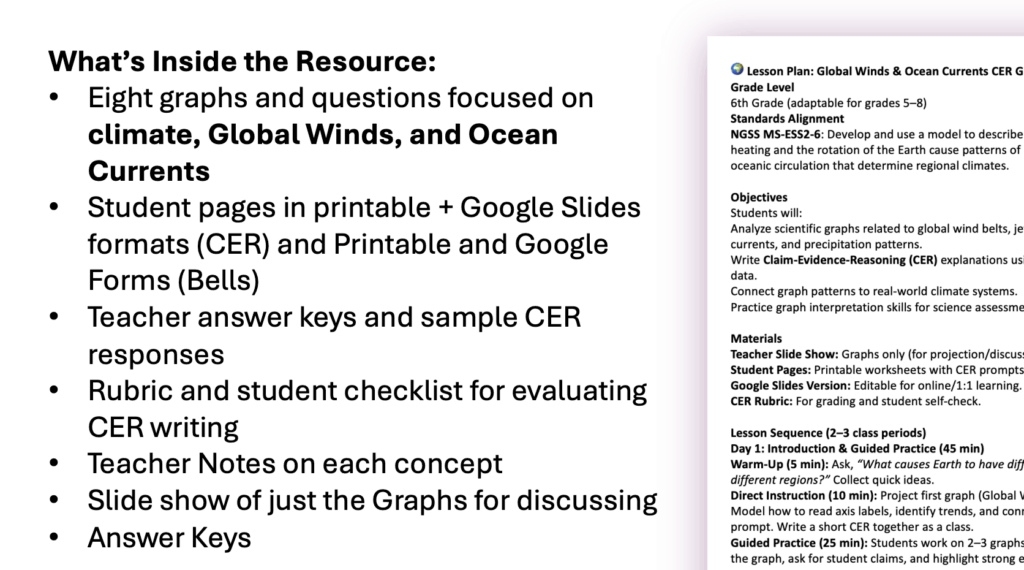
What’s Included:
- Eight graphs on ocean currents and global wind patterns
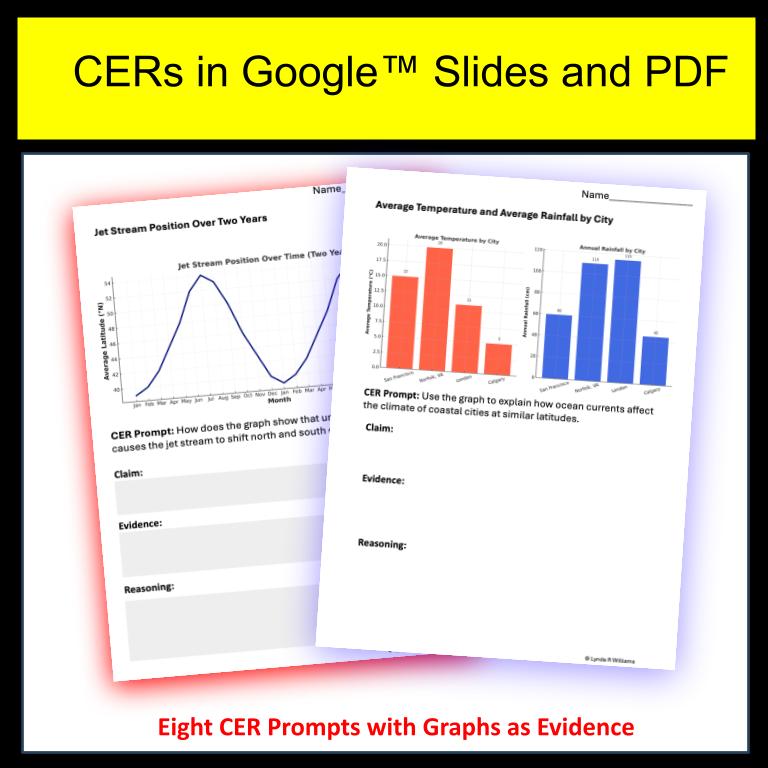
- Student-friendly CER prompts with space to write responses (Printable and Google Slides)
- Sample answers and teacher keys
- Daily bellringer activities for quick practice and review (Printable and self-checking Google Forms)
- Rubric and student checklist for CER writing
- Lesson Plan
- Teacher Notes for each concept
- Answer Keys
Why Teachers Love It:
- Saves planning time with ready-to-use Earth science graph activities
- Engages students with visual data tied to real climate patterns
- Strengthens both content knowledge and science skills
- Flexible for classwork, homework, or assessment prep
- Students will use the SEP of Analyzing Data and Making an Argument from Evidence
Bring data, climate science, and CER writing together in one resource that keeps students thinking deeply about how ocean currents and global winds affect weather and climate worldwide.
Graphs Included:
- Global Wind Belts – Average Wind Speed by Latitude
- Hadley vs. Ferrel Cell Temperatures
- Jet Stream Position Over Two Years
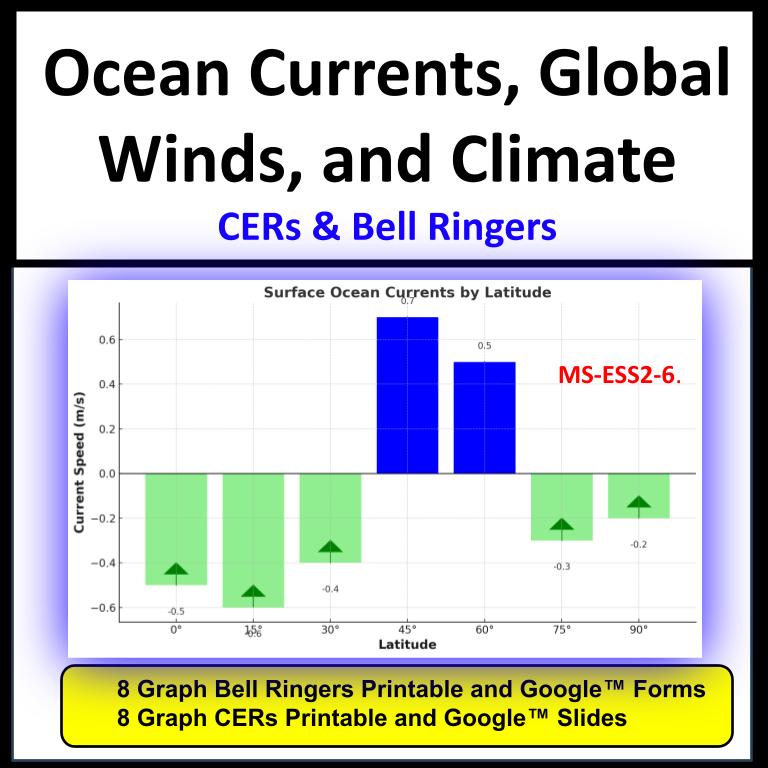
- Surface Ocean Currents by Latitude
- Gulf Stream Water Temperature vs. Latitude
- El Niño vs. La Niña Sea Surface Temperature
- Precipitation by Latitude
- Average Temperature and Average Rainfall by City
NGSS MS-ESS2-6 Develop and use a model to describe how unequal heating and rotation of the Earth cause patterns of atmospheric and oceanic circulation that determine regional climates.
The PDFs are not Editable.