
Description
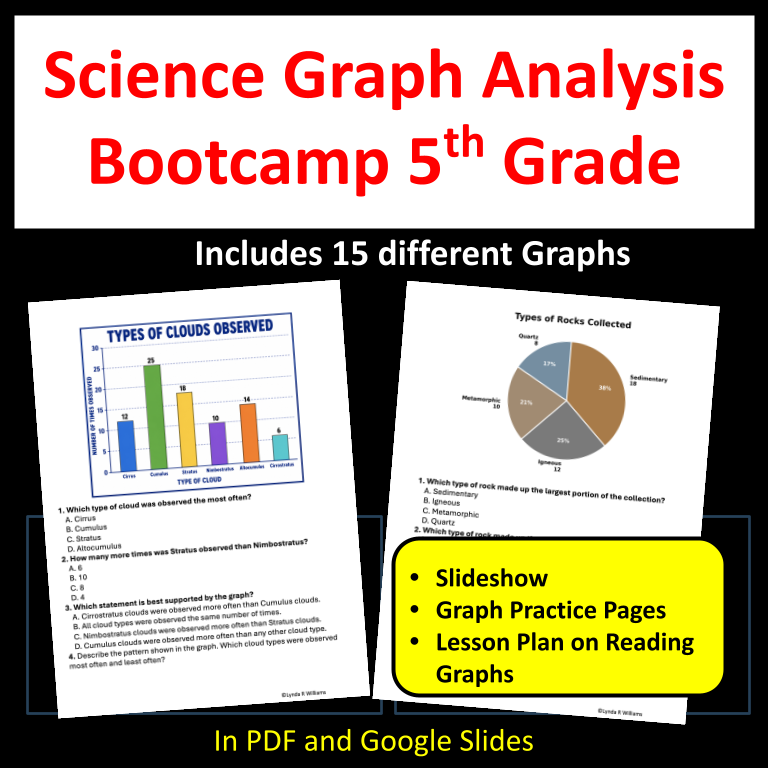
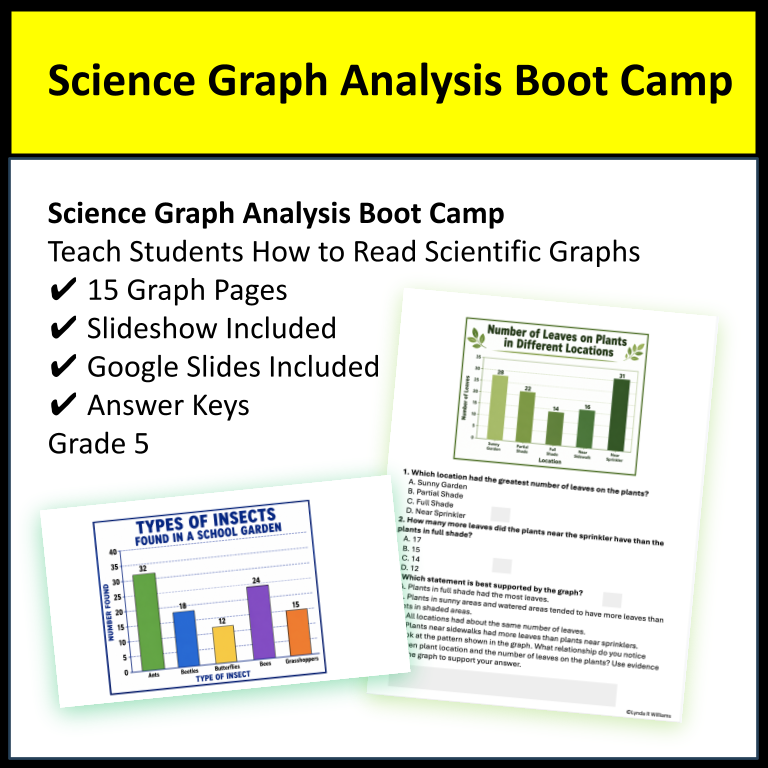
This Back-to-School Science Graph Analysis Boot Camp provides 5th-grade students with structured practice in analyzing data, identifying patterns, and drawing conclusions from scientific graphs. Students work through a variety of graph types while learning how scientists use data to make observations and support claims. Start the school year by building one of the most important science skills: reading and interpreting graphs!
This resource is designed for the beginning of the school year, making it perfect for reviewing graphing skills before students begin labs, investigations, and science units.
What’s Included:
• 15 science graph activities
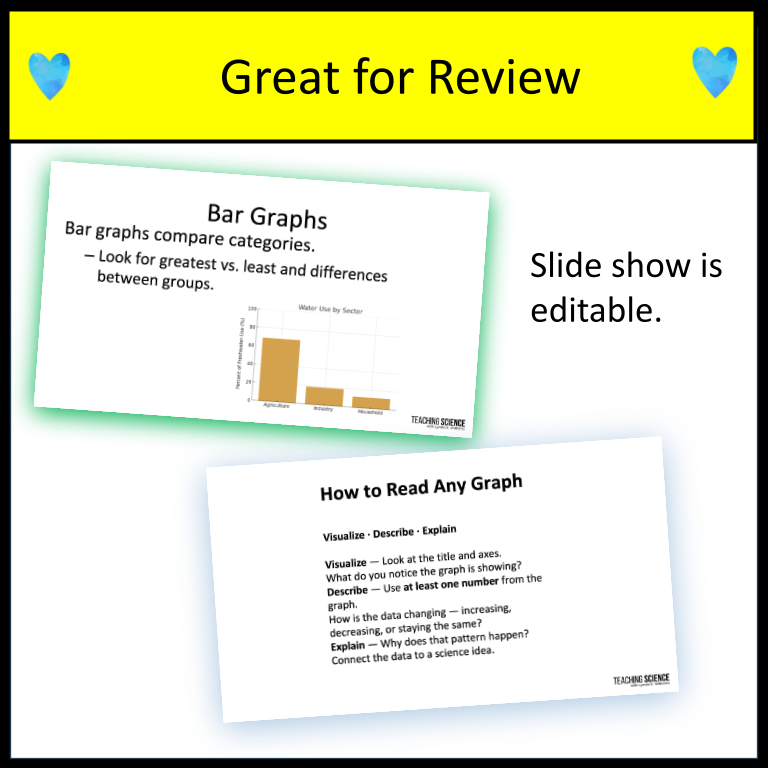
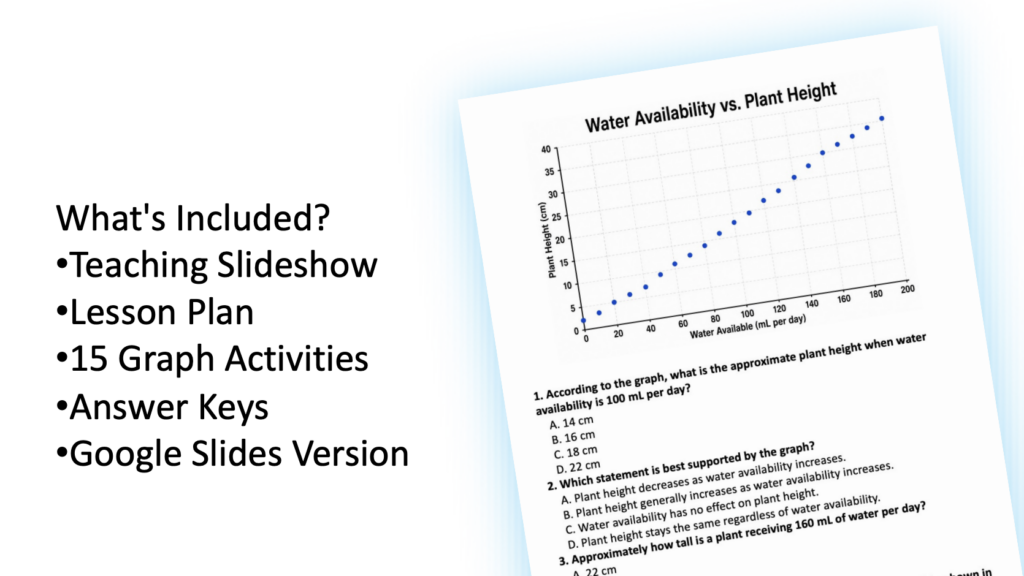
• Teaching slideshow
• Lesson plan
• Student practice pages
• Answer key
Graph Types Included:
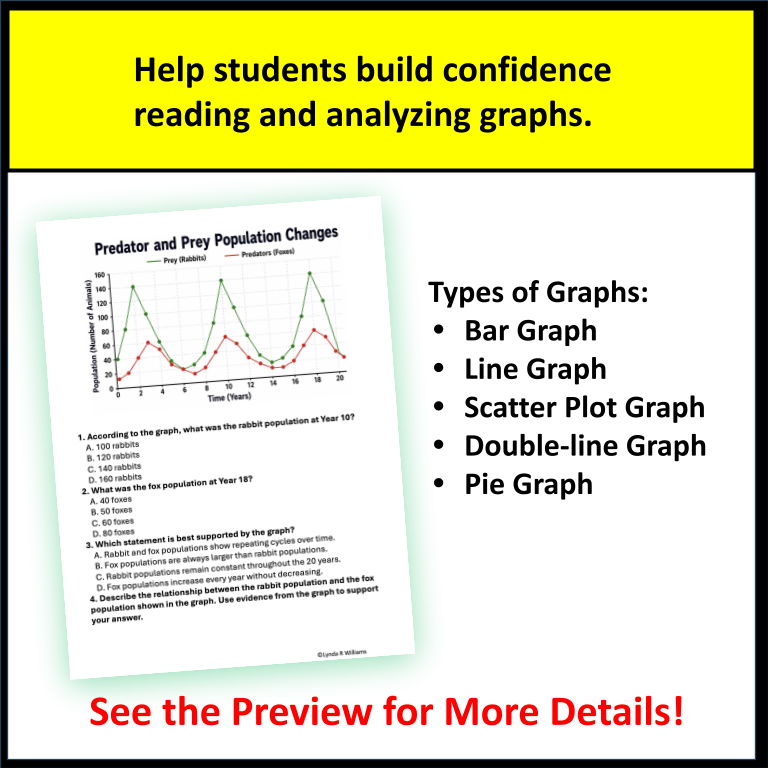
• Bar Graphs
• Line Graphs
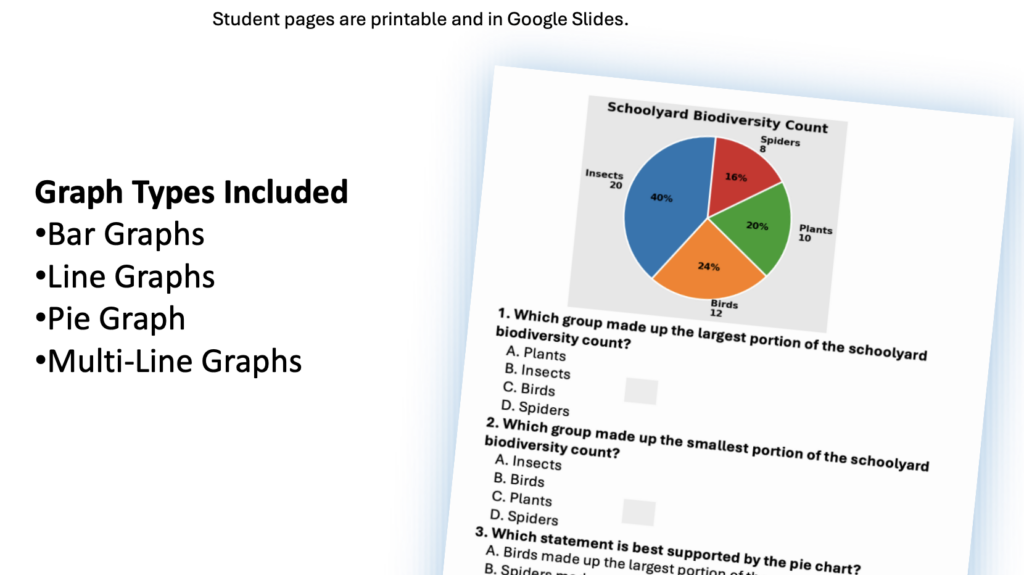
• Pie Charts
• Scatter Plots
• Multi-Line Graphs
Graph Topics Include:
• Plant growth
• Leaves on plants
• Bird sightings
• Weather conditions
• Cloud observations
• Insects in a school garden
• Rainfall by month
• Water availability and plant height
• Types of rocks collected
• Predator-prey populations
• Recycling collected
• Schoolyard biodiversity
• Screen time data
• Water consumption
Why Teachers Love This Resource:
✔ Builds graph-reading confidence
✔ Reviews 5 graph types
✔ Strengthens data-analysis skills
✔ Uses realistic science data
✔ Includes multiple-choice and short-answer practice
✔ No prep required
✔ Lesson plan and slideshow included
✔ Great for back-to-school review
✔ Supports science test prep
✔ Builds a foundation for future science learning
Perfect For:
• Back to School Science
• Science Boot Camps
• Data Analysis Practice
• Reading Graphs and Data
• Science Warm-Ups
• Test Prep
• Intervention
• Independent Practice
• Centers
• Whole-Class Instruction
Give students a strong start to the school year while building the graph-reading and data-analysis skills they will use all year long!
Save even more with my back to school bundle for 5th grade science!