Description
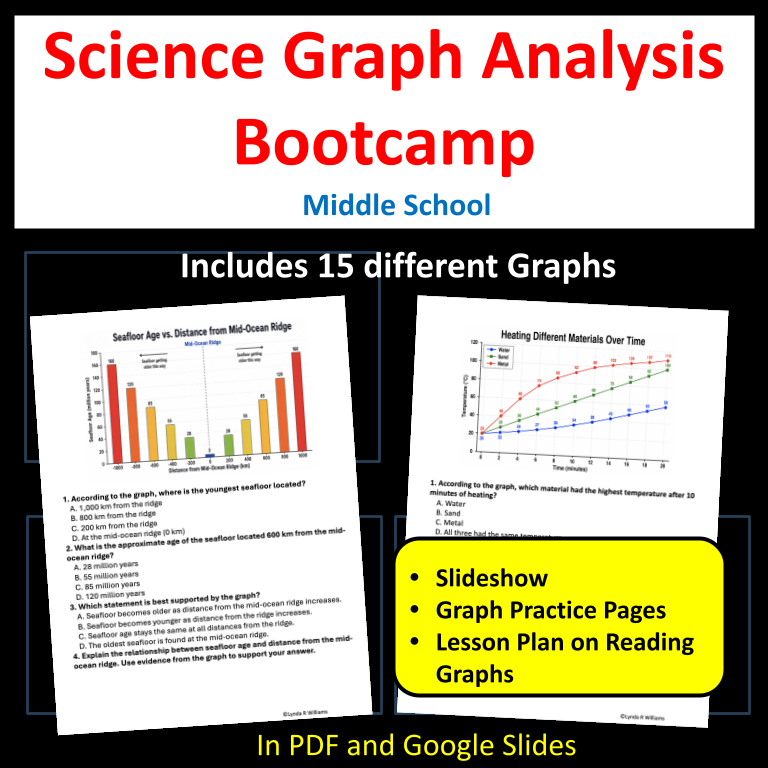
Start the school year by teaching one of the most important skills in middle school science: how to read, interpret, and explain scientific graphs. Perfect for Back-to-School Intro and Review.
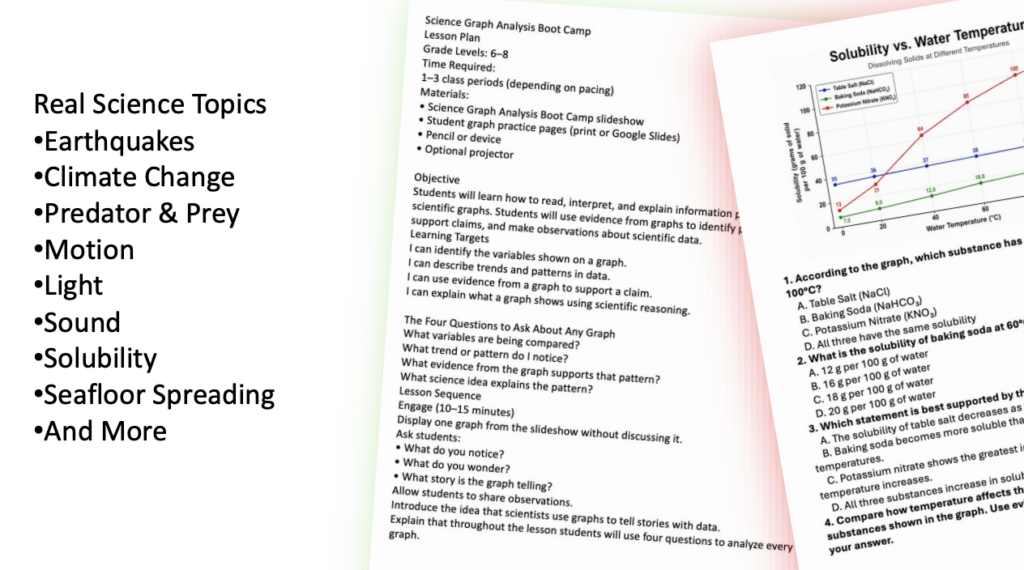
Many students are expected to analyze graphs on assessments long before they feel confident reading them. This Science Graph Analysis Boot Camp helps bridge that gap by explicitly teaching students how to identify variables, recognize patterns, use evidence, and explain scientific data.
Students begin with an instructional slideshow that teaches graph vocabulary, graph types, variables, trends, and a simple four-question framework for analyzing graphs. Students then apply those skills through 15 graph-analysis activities featuring real-world data from life, Earth, physical, and environmental science topics.
This resource is perfect for back-to-school skill-building, science review, intervention, test preparation, or any time students need extra practice reading graphs and analyzing data.
What’s Included
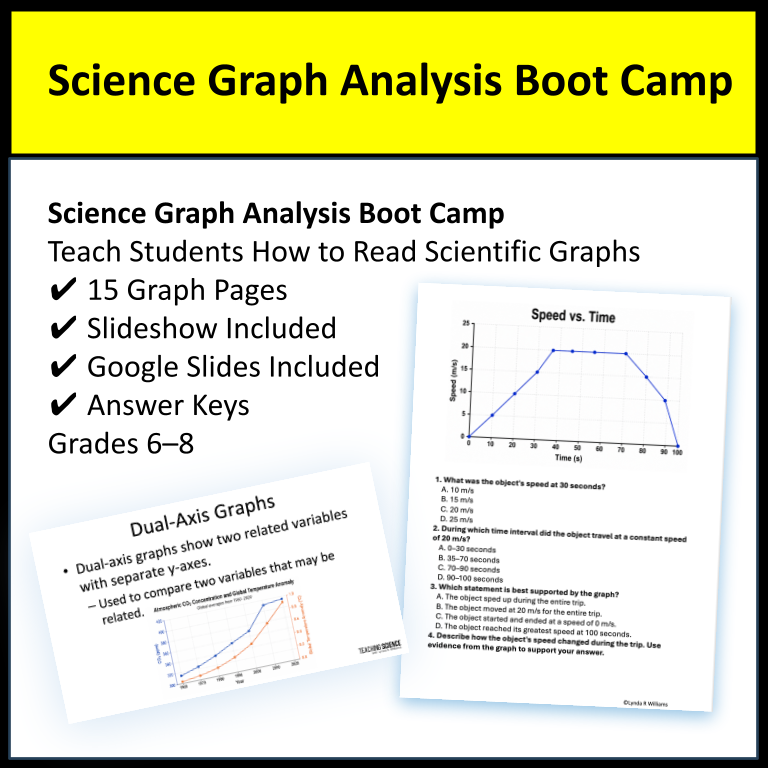
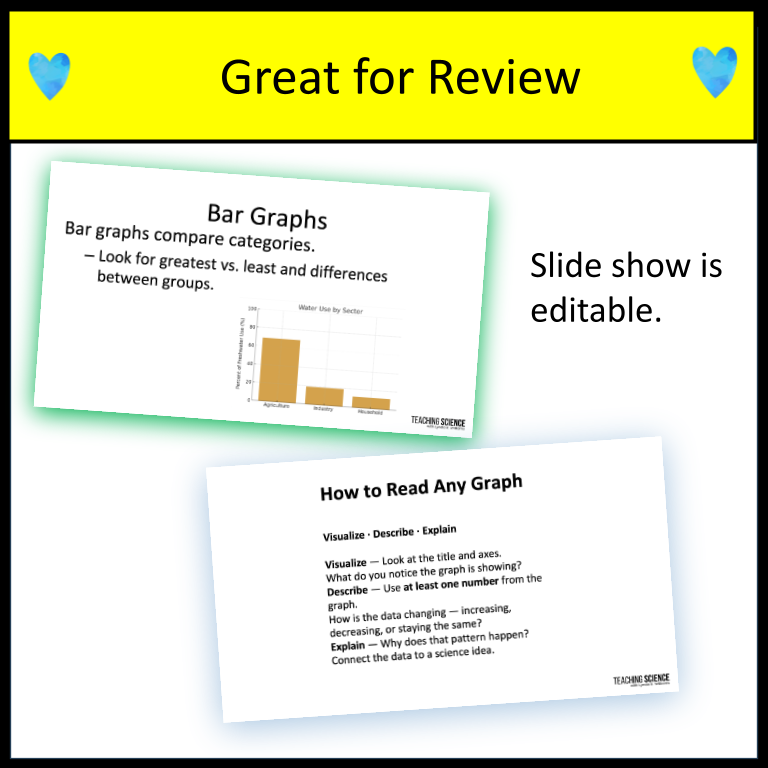
✔ Instructional slideshow
✔ Detailed lesson plan
✔ 15 graph analysis activities
✔ Answer keys
✔ Google Slides version for digital learning
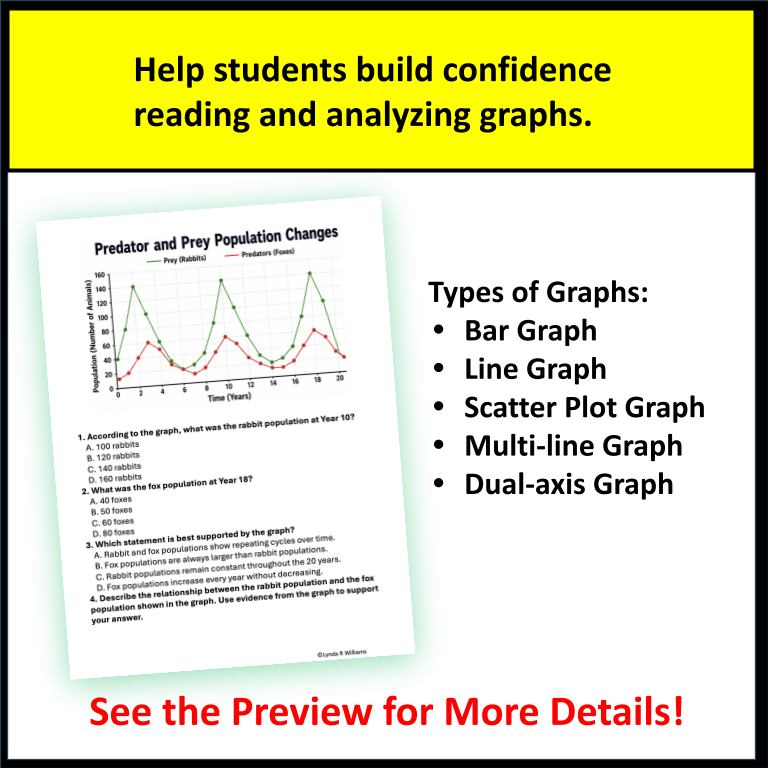
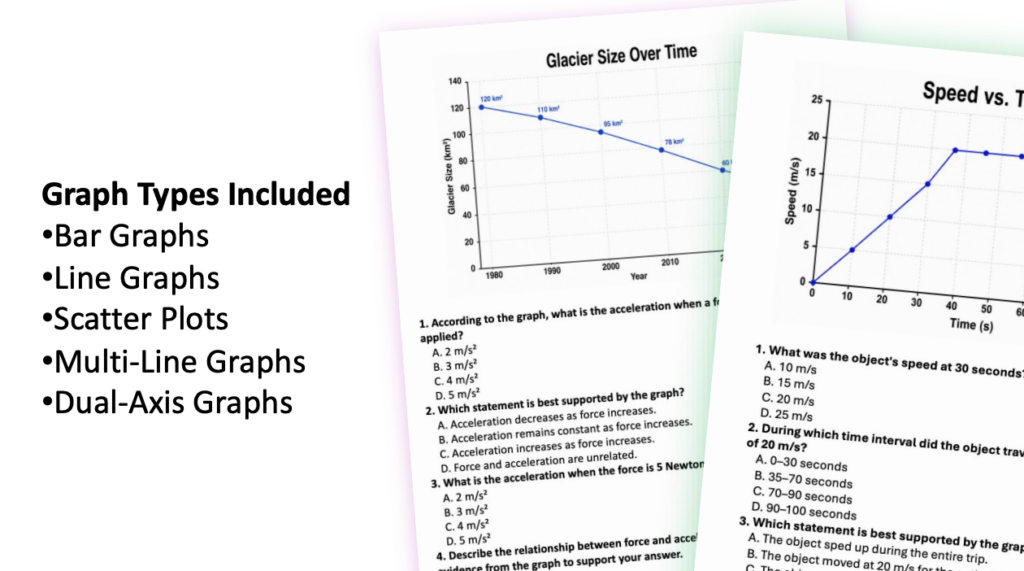
✔ Bar graphs
✔ Line graphs
✔ Scatter plots
✔ Multi-line graphs
✔ Dual-axis graphs
Students Practice
✔ Reading and interpreting graphs
✔ Identifying variables
✔ Recognizing trends and patterns
✔ Using evidence from data
✔ Analyzing graphs and data
✔ Explaining scientific relationships
Science Graph Topics Included
• Earthquake Frequency by Magnitude
• Bacterial Growth Over Time
• Average Monthly Rainfall by Biome
• Speed vs. Time
• Light Intensity vs. Distance
• Force vs. Acceleration
• Water Availability vs. Plant Height
• Sound Volume vs. Distance
• Solubility vs. Water Temperature
• Heating Different Materials
• Seafloor Age vs. Distance from Mid-Ocean Ridge
• Predator and Prey Population Changes
• Boiling Point of Substances
• Atmospheric CO₂ and Global Temperature Change
• Graph Types Reference Page
Perfect For
• Back-to-school science activities
• Middle school science
• Graph analysis practice
• Reading graphs and data
• Science test prep
• Bell ringers
• Intervention groups
• Independent practice
• Review activities
Grades 6–8
Formats Included: PDF and Google Slides
Help students become more confident, independent, and successful when reading graphs, interpreting data, and explaining scientific patterns.
Save even more with my back to school bundle for middle school science!