

Description
Bring real-world data analysis into your middle school science classroom with this Weather Graph Analysis Unit. Perfectly aligned with NGSS MS-ESS2-5, this resource helps students collect and interpret evidence about how the motions and complex interactions of air masses result in weather changes.
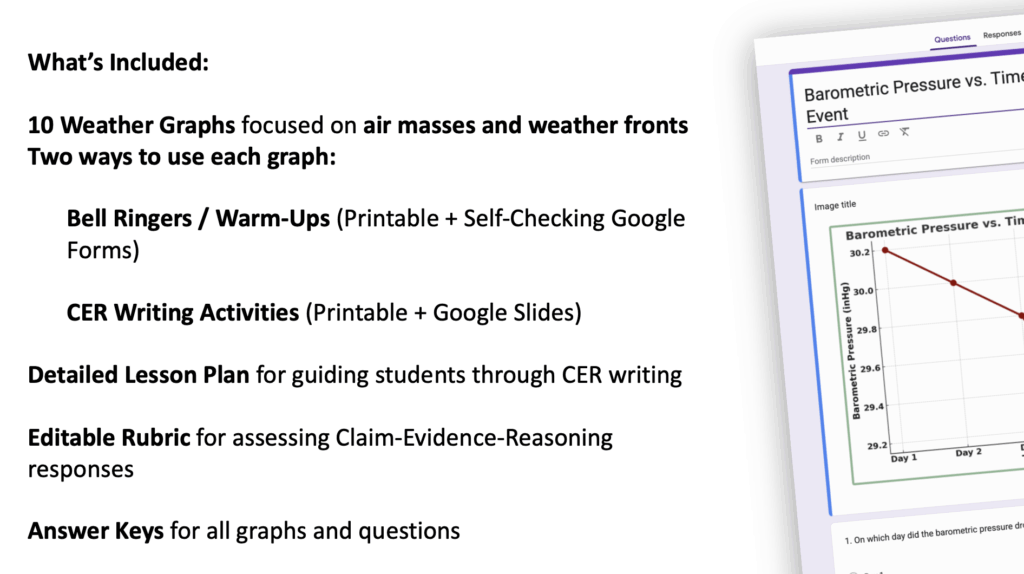
What’s Included:
- 10 Weather Graphs focused on air masses and weather fronts
- Two ways to use each graph:
- 10 Bell Ringers / Warm-Ups (Printable + Self-Checking Google Forms)
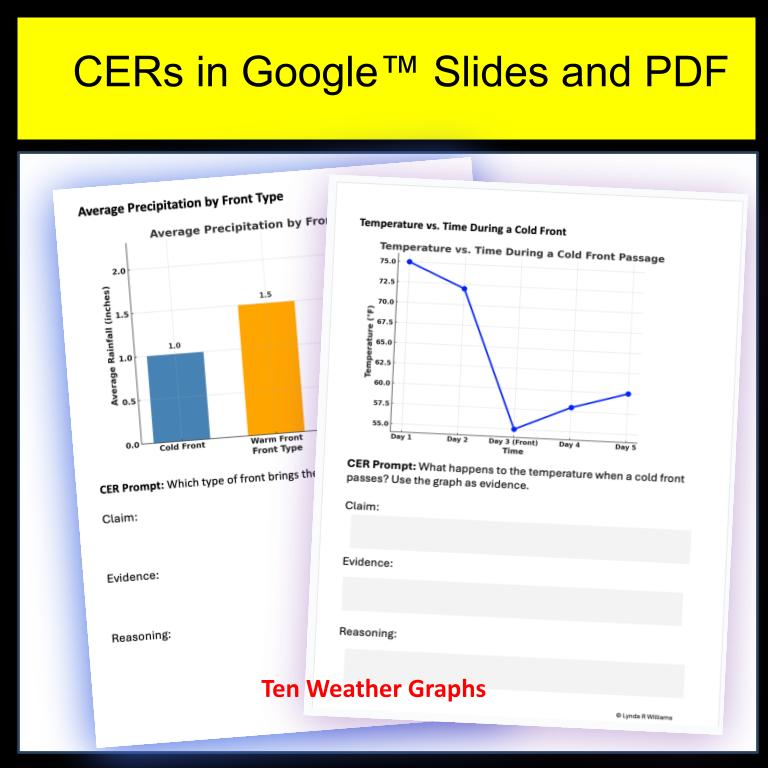
- 10 CER Writing Activities (Printable + Google Slides)
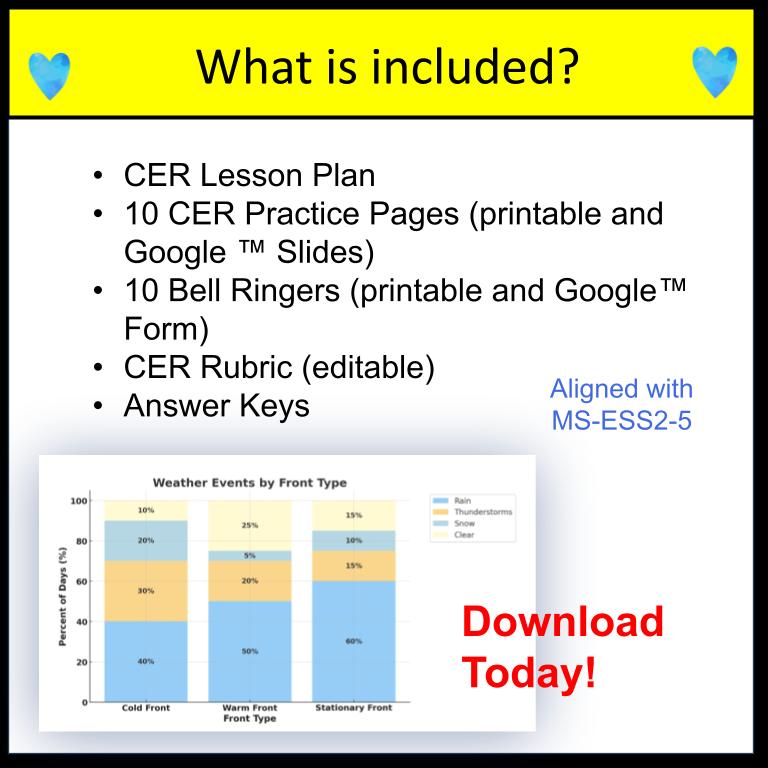
- Detailed Lesson Plan for guiding students through CER writing
- Editable Rubric for assessing Claim-Evidence-Reasoning responses
- Answer Keys for all graphs and questions
How Teachers Can Use This Resource:
- Kick off class with graph-based bell ringers that build data analysis and test-prep skills.
- Extend learning with CER writing prompts where students construct scientific explanations using evidence from graphs.
- Assign digitally in Google Forms/Slides or print for easy in-class practice.
- Save planning time with the included lesson plan, rubric, and keys—everything you need is ready to go!
Standards Alignment:
- NGSS MS-ESS2-5: Collect data to provide evidence for how the motions and complex interactions of air masses result in changes in weather conditions.
This all-in-one weather graph unit builds critical science practices, graph interpretation, data-driven explanations, and evidence-based reasoning, while giving students multiple opportunities to practice with engaging, ready-to-use materials.
Weather Fronts and Air Masses Graphs Included
- Temperature vs. Time During a Cold Front (Line Graph)
- Barometric Patterns
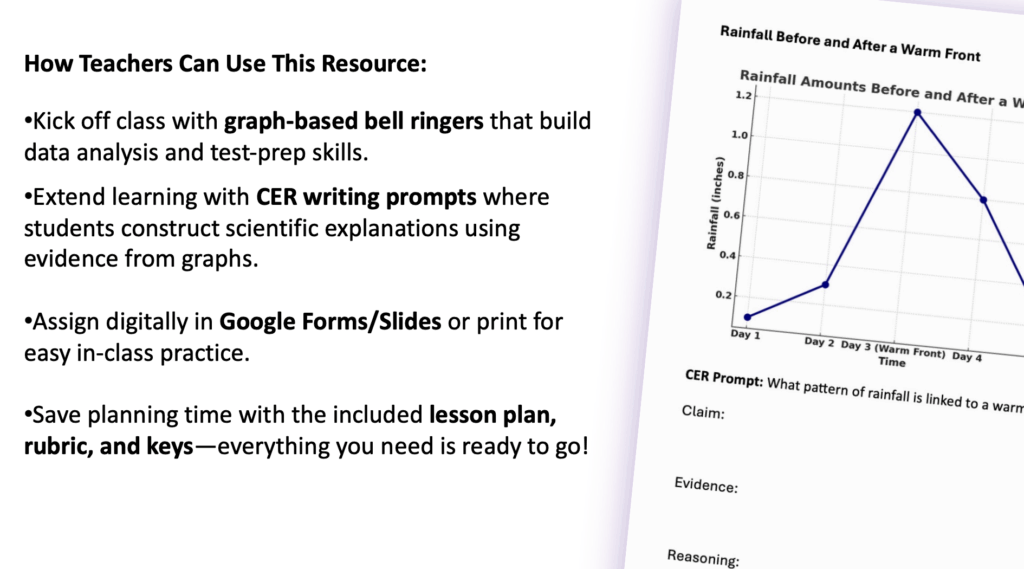
- Rainfall Amounts Before and After a Warm Front (Line Graph)
- Average Precipitation by Front Type (Bar Graph)
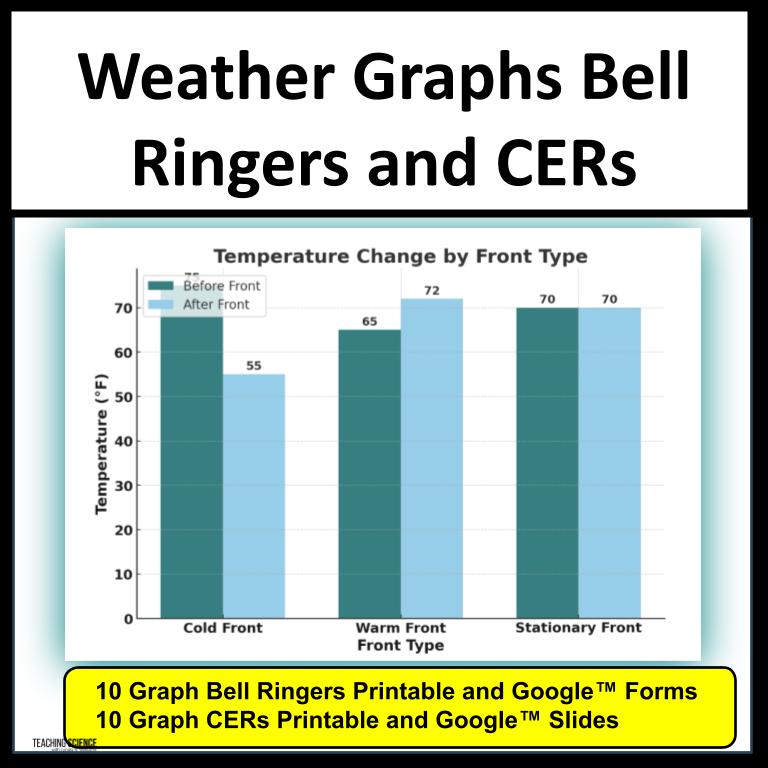
- Temperature Change by Front Type (Double Bar Graph)
- Weather Events by Front Type (Stacked Bar Graph)
- Temperature vs. Humidity During a Front (Scatter Plot)
- Daily Highs and Lows Before vs. After a Cold Front (Box Plot)
- Air Mass Influence in a Region (Pie Chart)
- Wind Speed vs. Time During a Cold Front (Line Graph)
Check out my blog post on helping students master CER with graph based practice!