Description
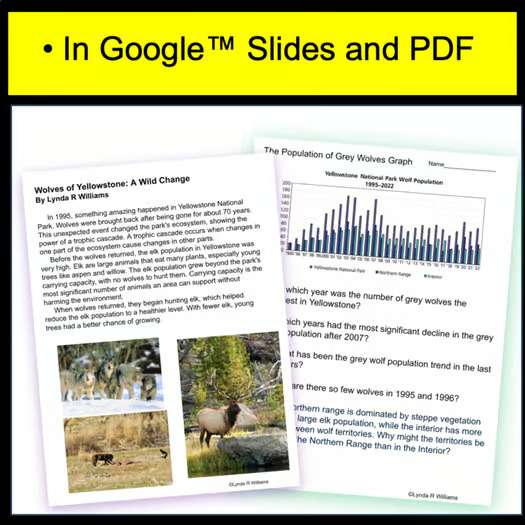
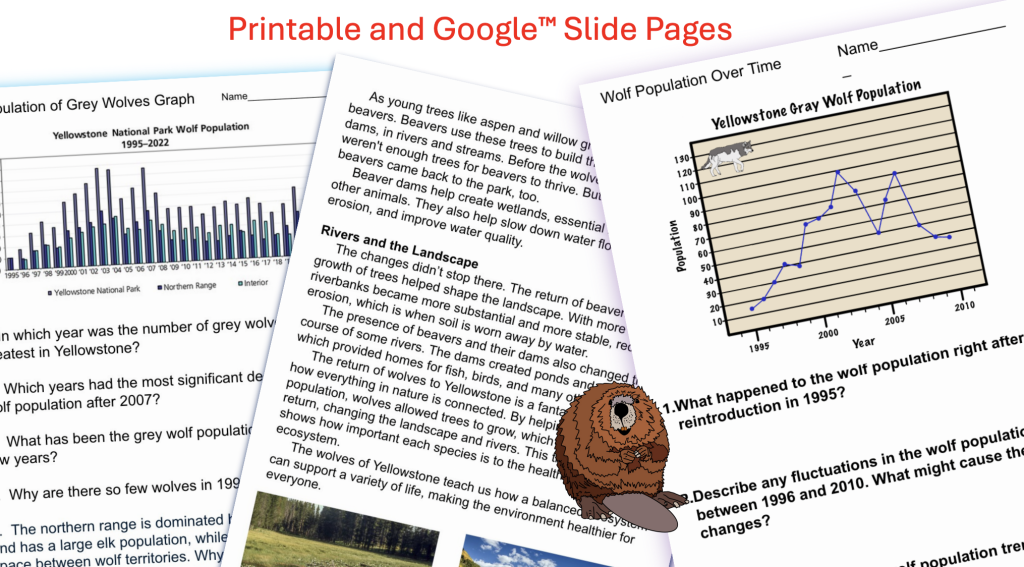
Do your students need more practice analyzing graphs? This resource explores the effects of the reintroduction of wolves to Yellowstone. Students will read a passage and look at population graphs to interpret the results of the reintroduction of wolves to Yellowstone. They will learn about trophic cascades, carrying capacity, and ecosystem interactions. Analyzing science graphs is an excellent practice for standardized testing. In printable and Google™ Slides.
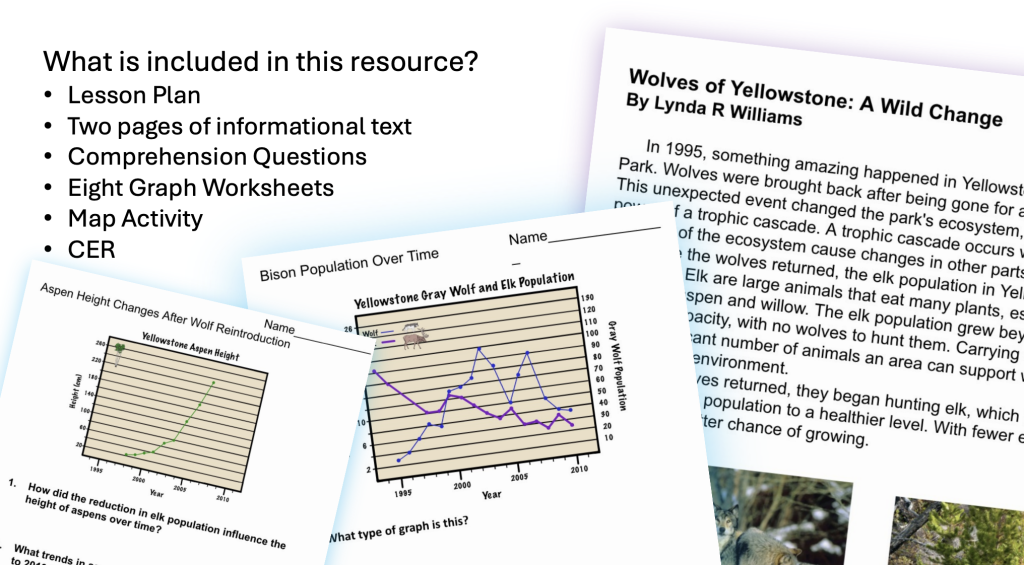
What does Wolves In Yellowstone include?:
- Lesson Plan
- Two-page reading passage on the Reintroduction of Wolves in Yellowstone
- Comprehension questions
- Eight graph pages with questions
- Map Activity
- CER
NGSS MS LS2-1
Analyze and interpret data to provide evidence for the effects of resource availability on organisms and populations of organisms in an ecosystem.
If every page is used, this resource will take 3-4 days to complete.
The Yellowstone Wolf Project is one of the most comprehensive studies of a large carnivore worldwide. Spanning three decades since the reintroduction of wolves to the park in 1995, this extensive research has significantly contributed to our understanding of these majestic animals. In this resource, students will analyze the effects of the increased wolf population on beavers, elk, bison, and aspen trees.
You will also love my Ecosystem Graph Resource


