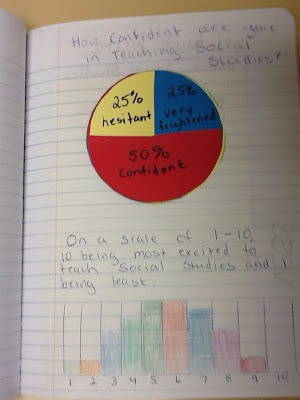
Here I have students demonstrate information using a circle graph and a bar graph. This one I used with my pre-service teachers. It could be easily adapted for elementary students to use to convey anything that can be demonstrated in graph form: gross national product, population, diversity of a region, data collected from science project, etc.