Do you need to teach students how to analyze graphs? Graphs are one of the most important tools scientists use to communicate information. Yet many students struggle to move beyond simply reading numbers on a graph. They often focus on individual data points rather than identifying patterns, trends, and relationships.
The good news is that graph analysis is a skill that can be taught, practiced, and improved over time. By using a consistent process, teachers can help students become more confident in analyzing scientific data and explaining its meaning.
Why Graph Analysis Matters in Science
Students encounter graphs throughout science instruction. They analyze data from investigations, interpret graphs on assessments, evaluate scientific claims, and use evidence to support explanations.
Strong graph-analysis skills help students:
- Interpret scientific data
- Identify patterns and trends
- Make evidence-based claims
- Develop critical thinking skills
- Prepare for state science assessments
- Strengthen CER (Claim, Evidence, Reasoning) responses
Rather than viewing graphing as a separate skill, students should see graphs as tools for understanding scientific phenomena.
Teach Students a Consistent Process to Analyze Graphs
One of the biggest mistakes students make is immediately trying to answer questions before understanding the graph.
Instead, teach students to follow the same process every time they encounter a graph.
Step 1: Read the Title
The title tells students what the graph is about.
Ask:
- What is being studied?
- What question does this graph help answer?
Step 2: Examine the Axes
Students should identify:
- The independent variable (x-axis)
- The dependent variable (y-axis)
- Units of measurement
This helps them understand what is changing and what is being measured.
Step 3: Look for Patterns
Students should scan the graph before reading any questions.
Ask:
- Is the data increasing?
- Is the data decreasing?
- Does it stay the same?
- Are there peaks or drops?
- Are there any unusual data points?
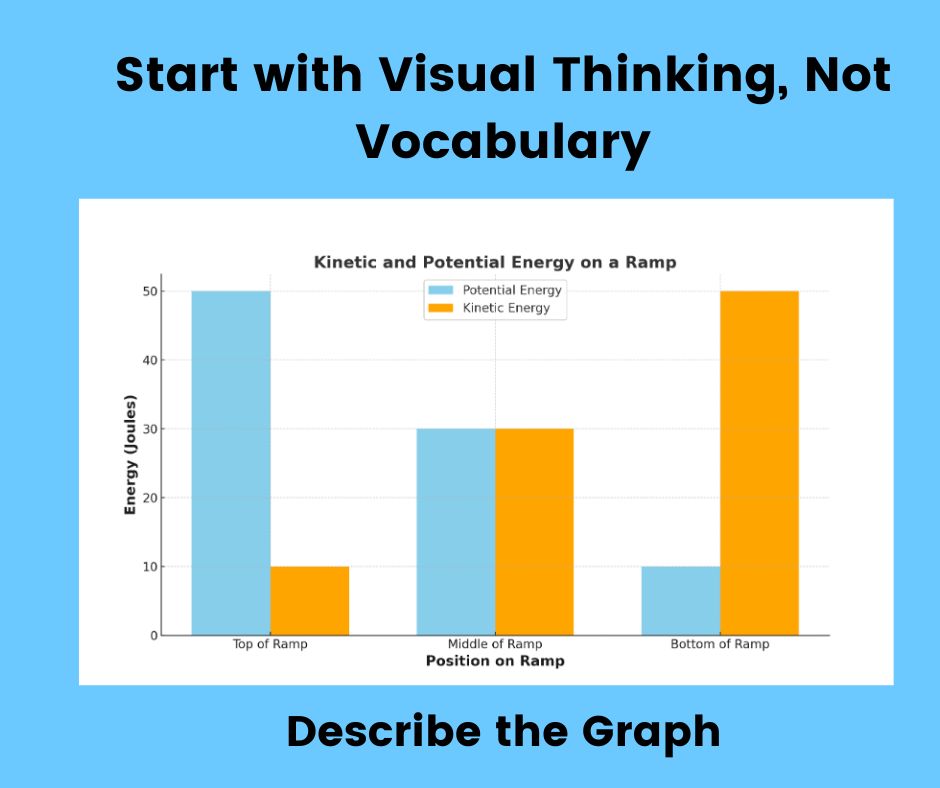
Step 4: Describe the Trend
Students should explain what they observe using complete sentences.
Instead of saying:
“The graph goes up.”
Teach students to say:
“As the temperature increased, the number of crickets chirping increased.”
Specific observations lead to stronger scientific explanations.
Step 5: Support Claims with Evidence
Students should always use data from the graph to support their answers.
For example:
“The plant receiving 8 hours of sunlight grew taller than the plant receiving 4 hours of sunlight. After 6 weeks, the first plant reached 22 cm while the second plant reached 12 cm.”
This habit prepares students for CER writing and science assessments.
Common Graph Analysis Mistakes
Many students make the same errors when interpreting graphs.
| Mistake | What Students Do | How to Fix It |
|---|---|---|
| Ignoring the title | Jump straight to the questions | Require students to read and restate the title |
| Skipping axis labels | Misinterpret the data | Highlight x-axis and y-axis before analysis |
| Focusing on one point | Ignore overall patterns | Ask students to describe the entire trend |
| Giving opinions | Make unsupported claims | Require evidence from the graph |
| Using vague language | Say “it goes up” or “it changes” | Teach precise scientific vocabulary |
Questions Students Should Ask When Analyzing a Graph
Provide students with a simple checklist.
| Question | Purpose |
|---|---|
| What is the graph about? | Understand the topic |
| What is shown on the x-axis? | Identify the independent variable |
| What is shown on the y-axis? | Identify the dependent variable |
| What trend do I notice? | Recognize patterns |
| Are there any unusual data points? | Identify anomalies |
| What evidence supports my answer? | Use data correctly |
This routine helps students become more independent when interpreting data.
Use Graph Analysis Throughout the Year
Students need repeated exposure to graphs across many contexts and practice analyzing them.
Include graph analysis in:
- Bell ringers
- Warm-ups
- Exit tickets
- Lab investigations
- Science stations
- Phenomena-based lessons
- Test review activities
Short, frequent practice sessions are often more effective than teaching graphing skills in a single unit. Students will benefit from learning to analyze graphs.
Why Spiral Review Helps Students Analyze Graphs
Research on retrieval practice and spaced learning suggests that students learn more effectively when they revisit skills over time rather than practicing them once and moving on.
When graph analysis appears regularly throughout the school year, students become faster at identifying trends, interpreting evidence, and drawing conclusions.
This repeated practice helps students build confidence to analyze graphs and perform better on assessments.
Final Thoughts on How to Teach Students to Analyze Graphs
Teaching students to analyze graphs is about much more than reading numbers. It is about helping students think like scientists.
When students learn to identify patterns, interpret evidence, and explain relationships in data, they develop skills that support every area of science learning.
A simple, consistent graph-analysis process can transform graphs from something students fear into one of the most powerful tools for understanding the world around them.
How Can We Use and Interact With Graphs Better? NSTA
About Lynda R. Williams
Lynda R. Williams is a science and STEM education expert with years of classroom experience teaching science and supporting teachers. She creates engaging, standards-aligned science resources that help students develop critical thinking skills, analyze data, and use evidence to explain scientific phenomena. Explore more science teaching resources and professional learning opportunities at Teaching Science.

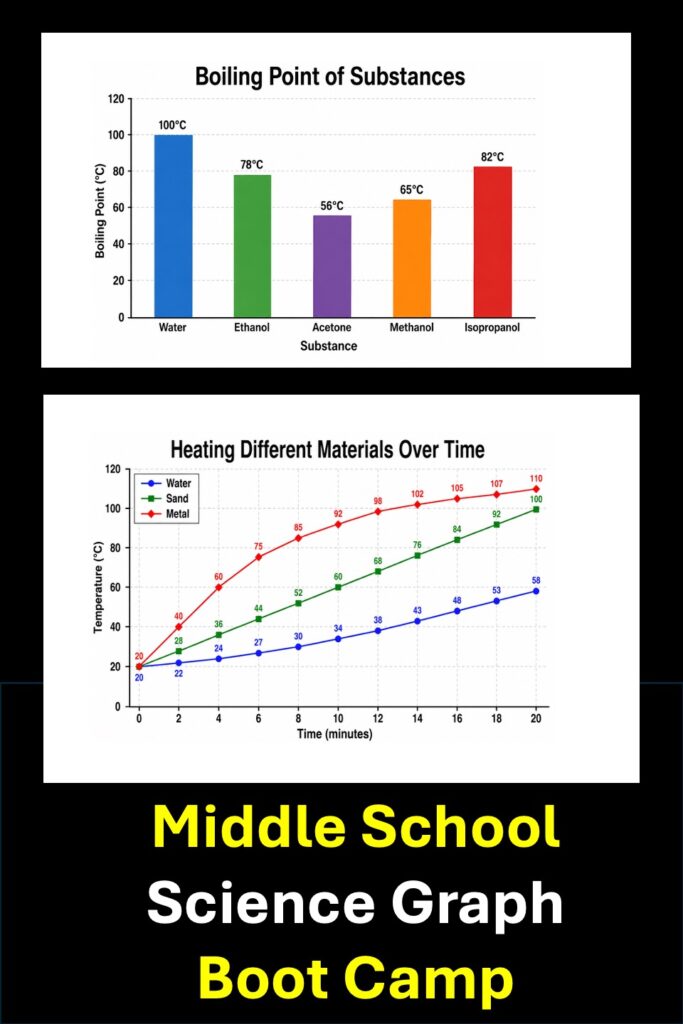
Learn more about Middle School Graph Boot Camp