Make Graph Analysis Part of Your Day
Students do not need a full lesson on graph analysis every time they practice.
In fact, short and frequent practice of middle school science graph analysis can be extremely effective.
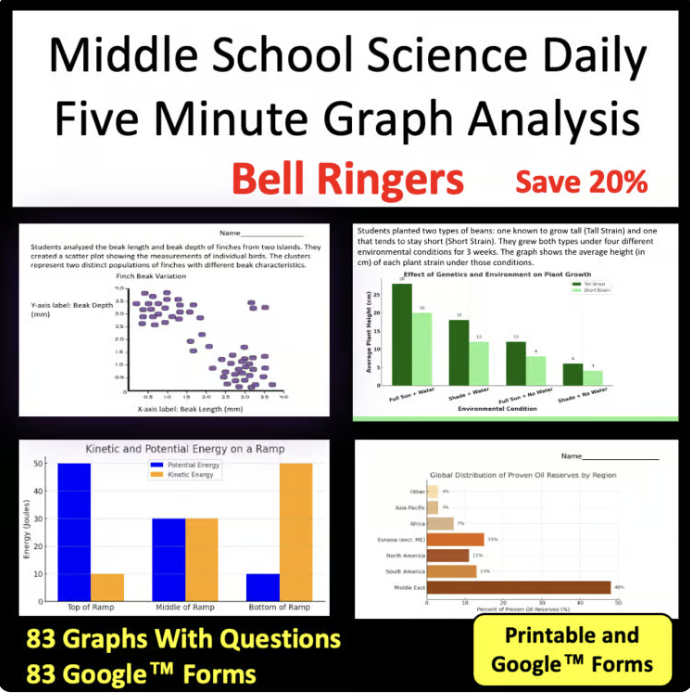
One of my favorite approaches is using 5-minute science graph bell ringers.
Students analyze one graph and answer a few questions about the data.
Over time, they become more comfortable with:
- Axes
- Scales
- Units
- Patterns
- Variables
- Data comparison
- Evidence
- Conclusions
Because each graph uses a science context, students are practicing both science content and data literacy at the same time.
Science Graphs Are Useful for More Than Graphing Lessons
Graph-analysis activities can fit into many parts of the science classroom.
Teachers can use them for:
- Bell ringers
- Warm-ups
- Science stations
- Early finisher activities
- CER practice
- Test preparation
- Small-group instruction
- Intervention
- Review
- Formative assessment
- Sub plans
- Homework
- Exit tickets
The goal is not necessarily to spend more instructional time teaching graphs.
The goal is to build data analysis into the science students are already learning.
Graph Analysis and Science Test Prep
Graph and data questions appear frequently in science assessments because they measure more than memorization.
Students may need to:
- Read unfamiliar data
- Interpret a model
- Compare variables
- Identify a pattern
- Evaluate evidence
- Select a conclusion supported by data
Students who regularly analyze graphs during the school year are less likely to see these questions as something completely new during testing season.
Instead of waiting until spring to practice data analysis, teachers can build these skills throughout the year.
Even five minutes at the beginning of class can provide significant repeated exposure.
Graph Analysis and the NGSS
Data analysis is woven throughout the Next Generation Science Standards.
One of the NGSS Science and Engineering Practices is Analyzing and Interpreting Data.
Students are expected to work with data as part of doing science, not simply memorize facts about scientific topics.
Depending on the performance expectation, students may need to:
- Analyze data
- Interpret patterns
- Use mathematical representations
- Compare relationships
- Evaluate evidence
- Support explanations or arguments
This is one reason I like using content-specific science graphs rather than isolated math graph worksheets.
Students can practice graph skills while also working with the kinds of phenomena, evidence, and scientific relationships they are expected to understand.
Middle School Science Topics That Work Especially Well With Graphs
Some science standards and topics naturally lend themselves to graph analysis.
Life Science
- Ecosystems
- Resource availability
- Carrying capacity
- Food webs
- Population changes
- Environmental factors affecting growth
- Genetic factors affecting growth
- Natural selection
- Trait frequency
- Evolution
Earth and Space Science
- Weather
- Climate
- Natural hazards
- Earth’s resources
- Human impacts
- Global temperature patterns
- Water distribution
- Earth system interactions
Physical Science
- Kinetic energy
- Speed
- Mass
- Motion
- Waves
- Thermal energy
- Chemical reactions
- Matter
These topics give students a reason to analyze the graph beyond simply practicing a mathematical skill.
| Graph or Data Display | Best Used For | Science Examples | Skills Students Practice |
|---|---|---|---|
| Bar Graph | Comparing categories or groups | Plant growth under different conditions, populations in different habitats, energy sources | Compare values, identify highest and lowest, calculate differences |
| Line Graph | Showing change over time or continuous relationships | Temperature changes, population growth, motion, weather data | Identify trends, describe increases and decreases, interpret change over time |
| Multiple-Line Graph | Comparing two or more data sets | Predator and prey populations, temperatures in different locations, experimental groups | Compare trends, use legends, identify relationships between variables |
| Pie Chart | Showing parts of a whole | Distribution of Earth’s water, energy sources, land use | Interpret percentages, compare proportions, understand part-to-whole relationships |
| Data Table | Organizing measurements or observations | Lab results, chemical reaction data, plant growth measurements | Locate data, compare values, recognize patterns, prepare data for graphing |
| Maps and Data Displays | Showing geographic or spatial patterns | Weather maps, natural hazards, resource distribution, climate data | Identify spatial patterns, compare locations, connect data to Earth science concepts |
Middle School Science Graph & Data Analysis Resources
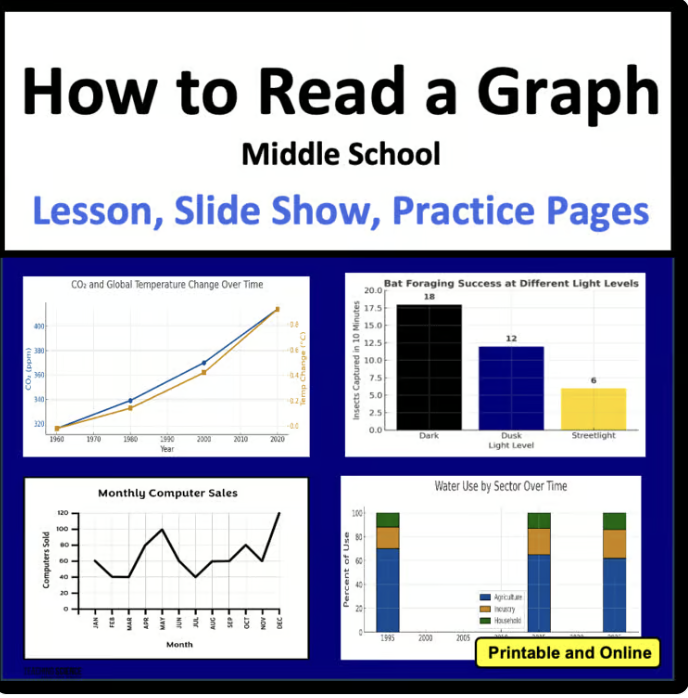
I have developed a growing collection of science resources designed to give students consistent, science-specific graph and data-analysis practice.
These include:
Middle School Science Bell Ringers & Daily Graph Warm-Ups
Short daily graph-analysis practice that can be completed in approximately five minutes.
Middle School Science Graphs & Analyzing Data
Graph and data-analysis practice designed for middle school science review and test preparation.
What’s the difference between these two resources?
The Middle School Science Bell Ringers & Daily Graph Warm-Ups set is designed for short, ongoing practice throughout the year. Students work with one graph at a time in quick warm-ups that build graph-reading and data-analysis skills over time.
The Middle School Science Graphs & Analyzing Data set focuses on concentrated graph-analysis practice, review, and test preparation. It works well when you want students to practice interpreting multiple types of science graphs and answering data-analysis questions in a more targeted way.
Use the Bell Ringers for daily practice. Use the Graphs & Analyzing Data set for deeper review and test prep.
CER Middle School Science Practice With Graphs & Data
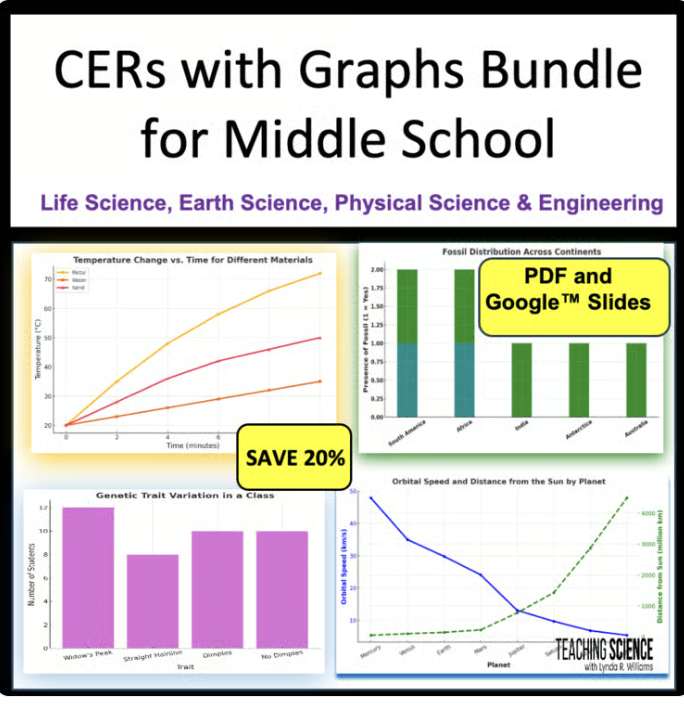
Students analyze scientific data and use evidence to develop claims and reasoning.
Life Science Graph Activities
Practice with ecosystems, populations, growth, natural selection, evolution, and other life science topics.
Earth Science Graph Activities with CERs
Practice analyzing weather, Earth systems, natural hazards, resources, environmental changes, and other Earth science data.
Physical Science Graph Activities
Practice with energy, forces, motion, waves, chemical reactions, and matter.
State-Specific Science Graph Resources
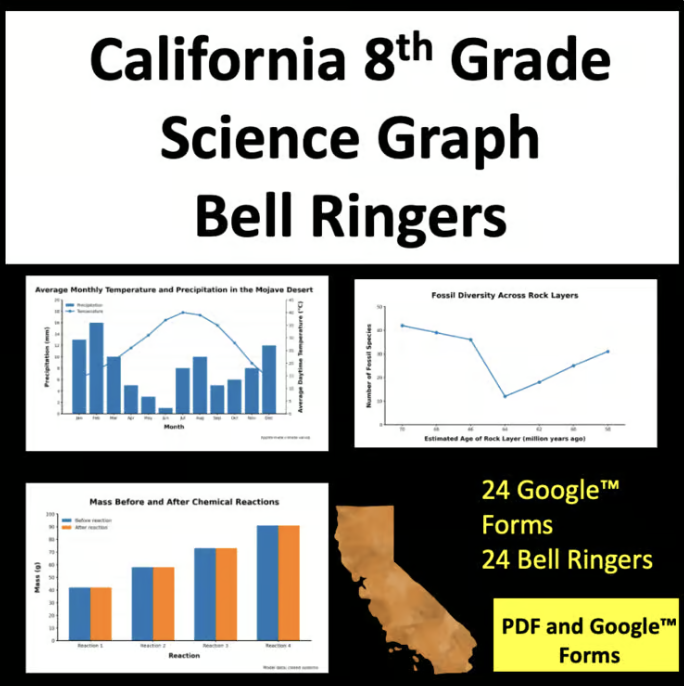
I also create graph-analysis resources aligned with science standards in individual states.
Frequently Asked Questions About Middle School Science Graph Analysis
How can I help middle school students get better at analyzing graphs?
Use short, repeated practice throughout the year. Have students identify titles, axes, units, scales, variables, patterns, and relationships before asking them to draw conclusions. Whenever possible, use science content they are already studying.
How often should students practice graph analysis?
Students benefit from regular exposure. Graph analysis does not always require an entire lesson. A short graph bell ringer once or several times a week can provide meaningful practice over the course of a school year.
What is the difference between reading a graph and analyzing a graph?
Reading a graph involves locating information such as a value or category. Analyzing a graph requires students to interpret patterns, compare data, identify relationships, draw conclusions, and use evidence.
Should graph analysis be taught in science or math?
Both subjects can help students develop graph literacy, but science graphs require students to connect data to scientific concepts. Students should have opportunities to analyze graphs within their science instruction.
What kinds of graphs should middle school students know?
Students should be comfortable interpreting bar graphs, line graphs, multiple-line graphs, percentage displays, tables, and other scientific data representations.
How can graphs be used with CER?
Graphs provide excellent evidence for Claim, Evidence, Reasoning responses. Students can make a claim, cite specific graph data as evidence, and then use scientific concepts to explain why the evidence supports the claim.
Are graph-analysis activities useful for science test prep?
Yes. Science assessments frequently require students to interpret unfamiliar graphs, tables, models, and other data displays. Consistent graph practice during the year can help students approach these questions more confidently.
Do students need to create graphs as well as analyze them?
Both skills are valuable. Creating a graph helps students understand variables, scales, axes, and data organization. Analyzing existing graphs gives students more opportunities to practice interpretation, comparison, evidence, and scientific reasoning.
Help Students Become Confident With Science Data
Graph analysis is not a skill students need only for a test.
Scientists use data to recognize patterns, test ideas, develop explanations, and support conclusions. When students learn to do the same thing, they begin to think more like scientists.
The goal is not simply for students to be able to read a graph.
The goal is for them to be able to look at scientific data and ask:
What does this evidence tell me?
Consistent graph and data-analysis practice can help middle school students develop that skill one graph at a time.
Explore my Middle School Science Graph & Data Analysis resources for grades 6–8.
Another Fun Way to Practice Graph Analysis: Crack the Code Activities
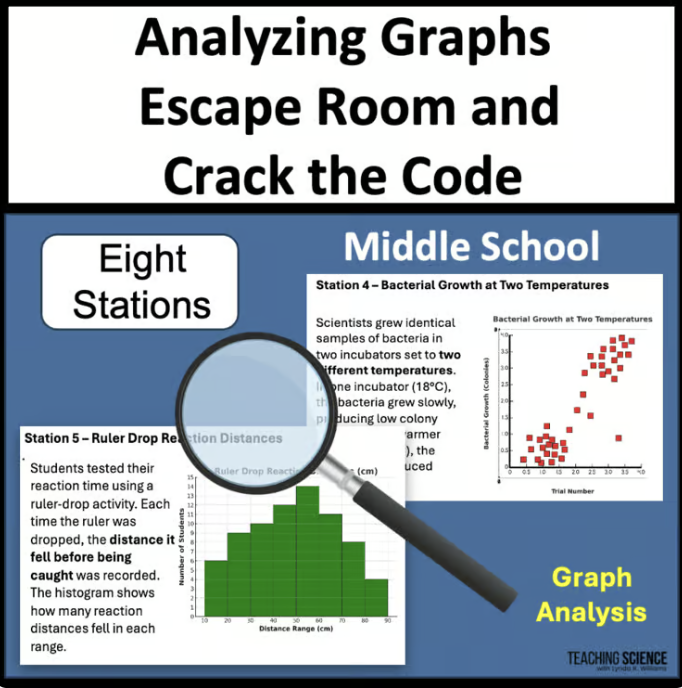
If you want students to practice graph analysis in a more interactive format, my Crack the Code science activities are another option.
Students rotate through science stations, analyze graphs and data, answer questions, and earn code tokens after their work is checked. At the end, they use a Polybius square to decode a mystery word.
These activities are especially useful when you want graph analysis to feel more like a challenge or station activity instead of a traditional worksheet.
They work well for:
- Science stations
- Small-group practice
- Review days
- Test prep
- Early finishers
- Seasonal science activities
- Engaging practice with specific science standards
Use Bell Ringers for quick daily practice, Graphs & Analyzing Data for focused review and test prep, and Crack the Code for interactive graph-analysis practice.
Lynda R. Williams is a science educator, curriculum designer, and creator of Teaching Science with Lynda R. Williams. With more than 20 years of classroom experience, she specializes in creating practical, standards-aligned science resources for upper elementary and middle school teachers. Her work focuses on helping students make sense of science through graph and data analysis, CER writing, phenomena-based instruction, 5E lessons, and hands-on STEM activities.
Lynda has also taught Science Methods at the university level and brings both classroom experience and curriculum expertise to the resources she creates. Her goal is to help teachers save time while giving students meaningful opportunities to analyze evidence, think scientifically, and build confidence with challenging science concepts.

You might also like this blog post: How to Teach Students to Analyze Science Graphs: A Step-by-Step Guide for Grades 3–8
and Tips for Teaching Students to Analyze Graphs