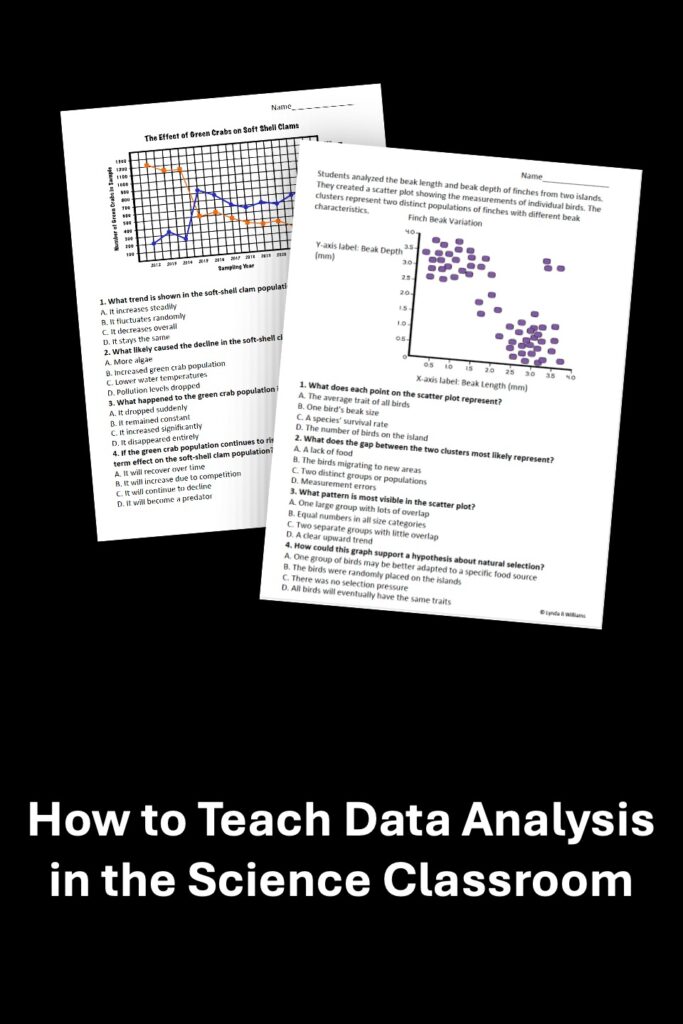
Do you need to learn how to teach data analysis in the science classroom? Are you wondering what the best practices are? Teaching students to analyze data is about much more than showing them how to read a graph. Students need repeated opportunities to identify patterns, compare values, recognize relationships, evaluate evidence, and explain what the data means.
A strong data-analysis routine helps students move from simply locating information to using evidence to support a scientific conclusion.
How Do You Teach Data Analysis in Science?
To teach data analysis in the science classroom, begin by helping students understand how the data are organized. Then guide them through a consistent process:
- Identify what was measured.
- Read the title, labels, units, and scale.
- Notice important values and patterns.
- Compare data points or groups.
- Identify relationships between variables.
- Use specific data as evidence.
- Explain what the evidence shows.
Students become more confident when they practice this process regularly with graphs, tables, diagrams, and other scientific data displays.
What Is Data Literacy in Science?
Data literacy is the ability to read, understand, analyze, and communicate information from data.
In science, data literacy includes being able to:
- Interpret graphs and data tables
- Identify patterns and trends
- Compare measurements
- Recognize relationships between variables
- Use evidence to support a claim
- Explain what the data suggests
- Notice when the data does not support a conclusion
Data literacy is not a skill students master during one graphing lesson. It develops through short, repeated practice across many science topics.
Students may understand concepts such as ecosystems, forces, weather, or cells, but still struggle to answer questions when those concepts are presented in a graph. Regular data-analysis practice helps students connect science content with scientific reasoning.
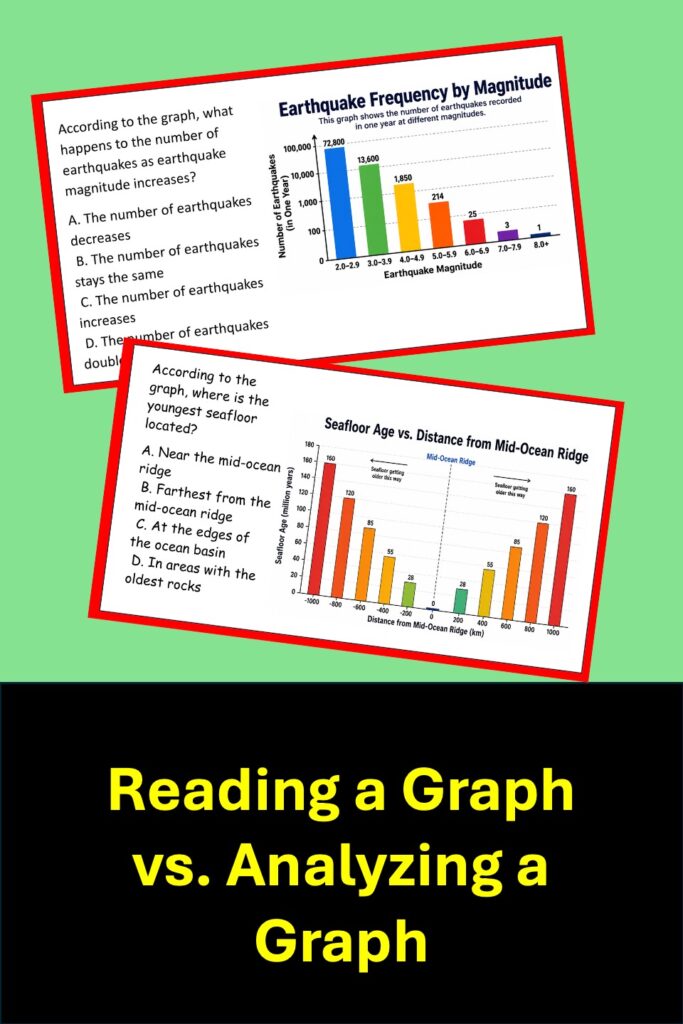
Reading a Graph vs. Analyzing a Graph
Reading a graph and analyzing a graph are related skills, but they are not the same.
| Reading a Graph | Analyzing a Graph |
|---|---|
| Identifying the title | Explaining what the title suggests about the investigation |
| Reading axis labels | Connecting the variables shown on the axes |
| Locating a value | Comparing values and explaining differences |
| Identifying the highest or lowest point | Describing an overall pattern or trend |
| Reading the scale | Using the scale to calculate changes or differences |
| Naming what increased or decreased | Explaining the relationship between the variables |
| Finding information | Using information as evidence for a conclusion |
A student who can read a graph may be able to tell you that a plant grew 12 centimeters. A student who can analyze the graph can explain how the plant’s growth compares with the other plants and what the data suggests about the variable being tested.
Start With the Basic Parts of the Data Display
Before students can interpret data, they need to understand how the information is organized.
Teach students to examine the following parts first:
Title
The title tells students what the graph or data table is about.
Ask:
- What was observed or measured?
- What scientific topic is represented?
- Does the title identify the two variables?
Labels
Labels identify the categories, variables, or measurements being shown.
Ask:
- What does the horizontal axis represent?
- What does the vertical axis represent?
- What categories are being compared?
Units
Units tell students how the data were measured.
Examples include:
- Degrees Celsius
- Centimeters
- Seconds
- Grams
- Milliliters
- Number of organisms
- Percent
Students should include the units when citing data. Saying that a plant grew “15” is incomplete. Saying that the plant grew “15 centimeters” communicates the measurement accurately.
Scale
The scale shows how the values are spaced.
Students often misinterpret graphs because they assume the scale increases by ones. Teach them to check the interval before answering questions.
Ask:
- Where does the scale begin?
- How much does each interval represent?
- Are the intervals equal?
- Does the scale begin at zero?
Teach Students to Notice Before They Explain
Students often rush to interpret a graph before carefully observing it.
One helpful strategy is to separate observations from explanations.
Begin with questions such as:
- What do you notice?
- Which value is highest?
- Which value is lowest?
- Where does the data increase?
- Where does the data decrease?
- Which values are similar?
- Are there any unusual data points?
These questions help students gather information without immediately making a claim.
After students have identified the important features of the data, move to interpretation questions:
- What pattern do you see?
- What relationship is shown?
- What might explain this pattern?
- What conclusion is supported by the data?
- What additional information would you need?
This progression helps students base their reasoning on evidence rather than guessing.
How Do Students Identify Patterns in Data?
A pattern is a repeated or predictable feature in a set of data.
Students may need to identify:
- An increasing trend
- A decreasing trend
- A repeating cycle
- A peak
- A plateau
- Similar values
- Differences between groups
- A positive relationship
- A negative relationship
- No clear relationship
- An outlier or unusual value
Students should be taught to describe the pattern before explaining why it may have occurred.
For example:
Observation: As light intensity increased, the rate of photosynthesis rose until it plateaued.
Interpretation: The data suggest that increasing light initially increased photosynthesis, but another factor may have limited the rate at higher light intensities.
The first statement describes the pattern. The second statement explains what the pattern may mean.
Use a Consistent Data-Analysis Routine
A consistent routine reduces students’ mental load because they know what to examine each time they encounter a new graph or data table.
One simple routine is:
1. Identify
What is being measured or compared?
2. Examine
Read the title, labels, units, key, and scale.
3. Notice
Find important values, changes, similarities, and differences.
4. Describe
State the overall pattern or relationship.
5. Support
Use specific data as evidence.
6. Explain
Describe what the evidence means scientifically.
This routine can be used with a simple elementary bar graph or a more complex middle school science data display.
Teach Students to Use Evidence From a Graph
Students often make general statements such as:
- The temperature increased.
- Group A grew more.
- The population went down.
- The experiment worked.
These statements may be correct, but they do not include evidence.
Teach students to cite specific values from the data.
Instead of writing:
The plant with more light grew taller.
A stronger response would be:
The plant that received eight hours of light grew to 18 centimeters, while the plant that received four hours of light grew to only 11 centimeters.
The second response provides measurable evidence.
A useful sentence frame is:
The data shows __________ because __________.
A more advanced sentence frame is:
As __________ changed from __________ to __________, __________ changed from __________ to __________.
Another option is:
The claim is supported by the data because __________.
Sentence frames can help students learn the structure of evidence-based responses without replacing the scientific thinking required.
What Questions Should Students Ask When Analyzing Data?
Students can use the following questions whenever they encounter a graph or data table.
Questions About the Structure
- What is the title?
- What variables are shown?
- What does each axis represent?
- What units are used?
- What does the key or legend show?
- What interval is used on the scale?
Questions About the Data
- What is the highest value?
- What is the lowest value?
- Which values are similar?
- Where does the data increase or decrease?
- Are there any sudden changes?
- Are there any unusual values?
Questions About Patterns
- What is the overall trend?
- Is there a positive or negative relationship?
- Is there a repeating pattern?
- Does the data level off?
- Is there a point where the pattern changes?
Questions About Evidence
- Which data values support the conclusion?
- Can I include specific numbers and units?
- Does all the data support the claim?
- Is there any evidence that does not fit the pattern?
Questions About Scientific Meaning
- What does the pattern suggest?
- What scientific concept may explain the results?
- What conclusion is supported?
- What additional data would make the conclusion stronger?
- What cannot be concluded from this data?
These questions help students move beyond finding answers and toward thinking like scientists.
Why Do Students Struggle to Interpret Graphs?
Students may struggle with data analysis for several different reasons.
They Focus on the Picture Instead of the Data
Students may view a graph as an image instead of a structured representation of information. They need explicit instruction on how titles, axes, labels, units, and scales work together.
They Do Not Read the Scale Carefully
A student may assume that each interval represents one unit even when the scale increases by 5, 10, or 100.
They Confuse the Variables
Students may identify the correct values but misunderstand which variable changed or what was measured.
They Describe Individual Points but Miss the Overall Pattern
A student may accurately read several data points but still fail to recognize the trend.
They Make a Claim Without Evidence
Students may understand the science concept but fail to include numbers or measurements from the graph.
They Repeat the Evidence Instead of Explaining It
Students may copy values from the graph without explaining what those values mean.
They Have Not Had Enough Practice
Graph analysis is often taught as a short unit and then assumed to be mastered. In reality, students need practice with different graph types and increasingly complex scientific contexts.
How Can Five Minutes of Daily Practice Improve Data Analysis Skills?
Students do not need a full class period of graph instruction every day. A short, focused routine can build skill over time.
Five minutes of daily graph practice gives students repeated opportunities to:
- Read titles, labels, units, and scales
- Interpret different types of graphs
- Identify patterns and trends
- Compare data
- Use numbers as evidence
- Explain relationships between variables
- Review science content
- Strengthen test-taking skills
Short practice sessions can also make data analysis feel less overwhelming. Instead of facing a long worksheet with many graphs, students focus on one manageable data display and a small number of questions.
This is why I use graph bell ringers as a regular science routine. A graph bell ringer can be completed at the beginning of class while the teacher takes attendance, checks homework, or prepares materials.
Over time, students become faster and more confident because the analysis process becomes familiar.
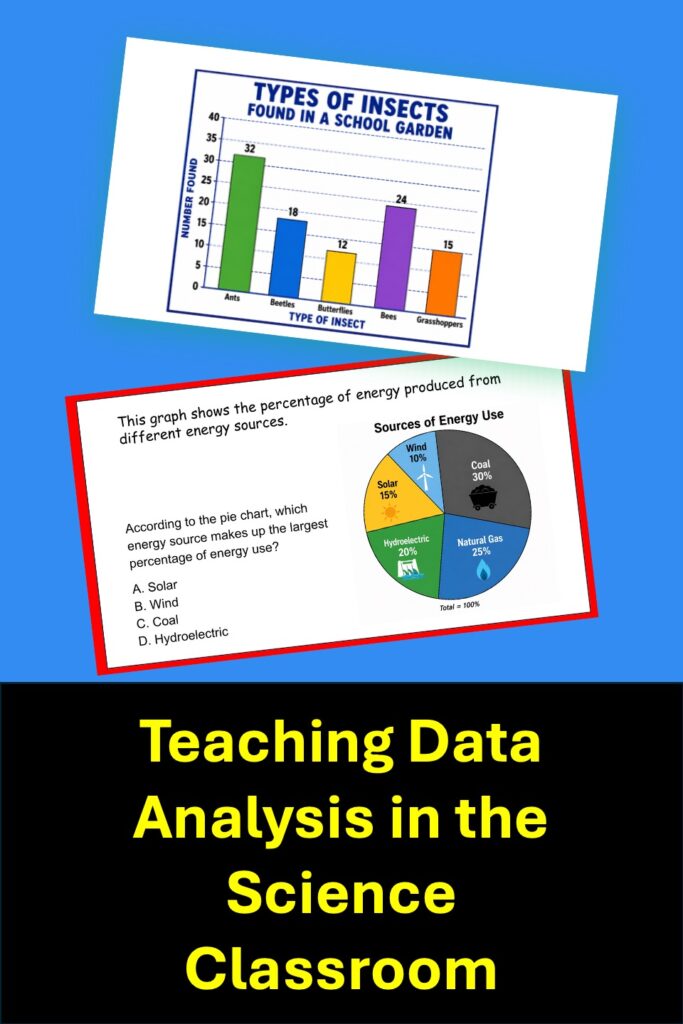
Use Different Types of Data Displays
Students should not practice with only one kind of graph.
Depending on their grade level, students may need experience with:
- Bar graphs
- Line graphs
- Pie charts or circle graphs
- Data tables
- Double-bar graphs
- Multi-line graphs
- Scatter plots
- Histograms
- Stacked bar graphs
- Dual-axis graphs
- Diagrams containing quantitative data
Begin with clear, accessible examples. Then gradually increase the complexity of the scale, number of variables, graph type, and questions.
Upper elementary students may begin with straightforward bar graphs, line graphs, and pie charts. Middle school students should also learn to interpret more complex data displays and compare multiple variables.
Connect Data Analysis to Science Content
Graph analysis should not be taught only as an isolated math skill.
Students need to interpret data within meaningful science contexts, such as:
- Plant growth
- Weather patterns
- Ecosystem populations
- Energy transfer
- Forces and motion
- Particle motion
- Earthquakes
- Rock layers
- Photosynthesis
- Cellular respiration
- Waves
- Chemical reactions
- Inheritance and variation
Using science-based graphs allows students to practice two skills at once. They review important content while strengthening data literacy.
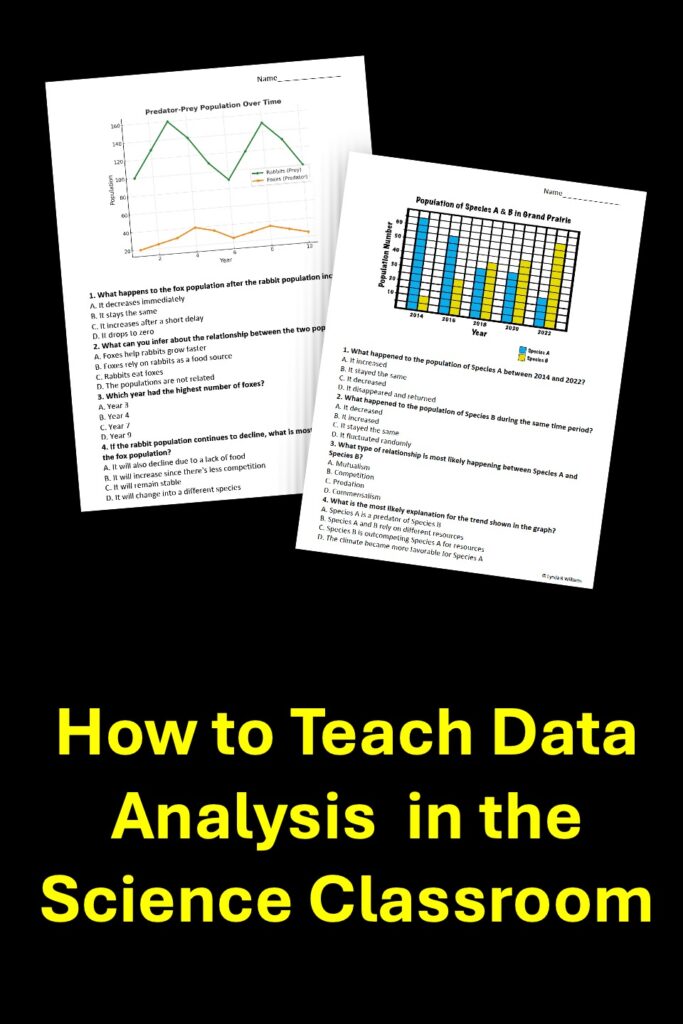
A graph about predator and prey populations, for example, can reinforce ecosystem relationships while also helping students identify repeating patterns and compare changes over time.
Gradually Increase the Level of Thinking
Not every graph question requires the same level of reasoning.
A helpful progression is:
Level 1: Locate Information
- What was the temperature at 2:00 p.m.?
- Which group had the greatest mass?
- How many organisms were counted?
Level 2: Compare Values
- How much greater was Group A than Group B?
- Which two values were most similar?
- During which time period did the largest increase occur?
Level 3: Identify Patterns
- What trend is shown?
- How did the population change over time?
- What relationship exists between the variables?
Level 4: Use Evidence
- Which data supports the conclusion?
- What two values provide the strongest evidence?
- How does the graph support the claim?
Level 5: Explain and Evaluate
- What scientific concept may explain the pattern?
- Is the conclusion fully supported by the data?
- What additional evidence would strengthen the investigation?
- What limitation should be considered?
This progression helps teachers scaffold instruction while still challenging students to move toward deeper analysis.
Use Graph Boot Camps for Focused Skill Instruction
Some students need more than occasional graph practice. A focused graph-analysis unit can explicitly teach the skills students will use throughout the year.
A Graph Boot Camp can help students practice:
- Reading titles, axes, labels, and scales
- Identifying graph types
- Comparing values
- Calculating differences
- Recognizing trends
- Interpreting relationships
- Using evidence
- Explaining conclusions
A focused introduction is especially helpful at the beginning of the school year. Once students understand the process, graph bell ringers can provide continued review and reinforcement.
[Add link to Graph Boot Camps]
Use State-Specific Graph Practice
Although data-analysis skills apply across science standards, the topics and level of complexity may vary by grade and state.
State-specific graph bell ringers can combine data analysis practice with the exact science content students are expected to learn.
This allows teachers to:
- Reinforce state science standards
- Review content throughout the year
- Prepare students for state assessment formats
- Practice science and engineering skills
- Identify misconceptions before testing
The goal is not simply to teach students how to answer test questions. It is to help them independently interpret scientific evidence in any context.
[Add links to State-Specific Graph Bell Ringers]
Make Data Analysis Interactive
Students can also practice graph analysis through stations, collaborative activities, and problem-solving challenges.
Graph-analysis Crack the Code activities give students a reason to carefully examine each data display. Students analyze the graph, answer questions, and use their answers to complete a larger challenge.
This format can be especially effective for:
- Review
- Science stations
- Small groups
- Early finishers
- Test preparation
- Substitute plans
- End-of-unit practice
The activity remains academically focused while giving students a more interactive way to practice.
[Add links to Graph-Analysis Crack the Code Activities]
Common Mistakes to Avoid When Teaching Data Analysis
Asking Only Basic Questions
Questions about highest, lowest, and exact values are useful, but students also need to explain patterns and use evidence.
Teaching Graphing Only Once
Data analysis should be revisited throughout the year.
Using Only Perfect Data
Real scientific data may include variation or unusual values. Students should learn that not every graph forms a perfectly smooth pattern.
Giving Away the Conclusion
Graph titles, captions, or questions should not reveal the pattern students are supposed to identify.
For example, a title such as “Plant Growth Increases With More Water” tells students the conclusion. A more neutral title would be “Plant Growth at Different Amounts of Water.”
Accepting Answers Without Evidence
Encourage students to include specific numbers and units whenever the data allows.
Moving to Explanation Too Quickly
Give students time to observe, compare, and describe the data before asking them to explain why the pattern occurred.
A Simple Weekly Data-Analysis Routine
Teachers can build data literacy without adding a large new unit to their schedule.
| Day | Data-Analysis Focus |
|---|---|
| Monday | Read the title, labels, units, and scale |
| Tuesday | Locate and compare important values |
| Wednesday | Identify the overall pattern or relationship |
| Thursday | Use specific data as evidence |
| Friday | Explain the scientific meaning or evaluate a conclusion |
This routine can be repeated with a new graph each week. As students become more skilled, several steps can be combined into one five-minute bell ringer.
Data Analysis Supports Scientific Reasoning
Students analyze data because scientists use evidence to understand the natural world.
Graph analysis supports many important science practices, including:
- Planning and carrying out investigations
- Analyzing and interpreting data
- Constructing explanations
- Engaging in argument from evidence
- Using mathematics and computational thinking
- Identifying patterns
- Recognizing cause-and-effect relationships
When students learn to interpret data, they are not simply preparing for a test. They are learning how scientific knowledge is developed and supported.
Final Thoughts
The best way to teach data analysis is through explicit instruction followed by consistent practice.
Students need to learn how to read a graph’s structure, identify key values, recognize patterns, compare evidence, and explain what the data mean. These skills should be practiced throughout the year and across many science topics.
Short routines such as graph bell ringers can make data analysis a regular part of science instruction without taking time away from labs, investigations, or content lessons.
With repeated practice, students move from asking, “Where is the answer?” to asking, “What does the evidence show?”
Frequently Asked Questions About Teaching Data Analysis
What is the difference between reading and analyzing a graph?
Reading a graph involves locating information such as titles, labels, units, and individual values. Analyzing a graph involves comparing values, identifying patterns, interpreting relationships, and using evidence to support a conclusion.
How often should students practice graph analysis?
Students benefit from short, frequent practice. A five-minute graph bell ringer, completed several times each week, can be more effective than limiting graph instruction to a single unit.
What should students look at first when analyzing a graph?
Students should first read the title, axis labels, units, scale, and key. These features explain what the data represents and how it is organized.
How can students use a graph as evidence?
Students should cite specific values, comparisons, or changes from the graph. Strong evidence includes numbers and units rather than a general statement about what happened.
What types of graphs should students learn to analyze?
Upper elementary students commonly analyze bar graphs, line graphs, pie charts, and data tables. Middle school students may also work with scatter plots, histograms, double-line graphs, stacked bar graphs, and other more complex data displays.
Why is data analysis important in science?
Data analysis helps students recognize patterns, evaluate evidence, explain scientific relationships, and make conclusions based on observations rather than opinions.
About the Author
Lynda R. Williams is an experienced science educator, curriculum writer, and former university science-methods instructor. She creates practical science resources for grades 5 through 8 that help teachers develop students’ data literacy, scientific reasoning, and evidence-based thinking through consistent, classroom-friendly practice.