
Description
This is an Engineering Claim Evidence Reasoning Unit with Engineering Graphs for CERs. Provide CER Activities with clear evidence from the graphs!
Bring engineering design to life with this Claim-Evidence-Reasoning (CER) Graph Analysis Unit! Perfect for upper elementary and middle school, this resource engages students in analyzing real-world engineering data to evaluate and improve design solutions.
With 24 unique, standards-aligned engineering graphs, students practice interpreting data, identifying criteria and constraints, and supporting claims with evidence and reasoning. Each graph is based on an authentic engineering scenario from testing bridge designs to optimizing wind turbines, helping students connect classroom learning to real-world problem solving.
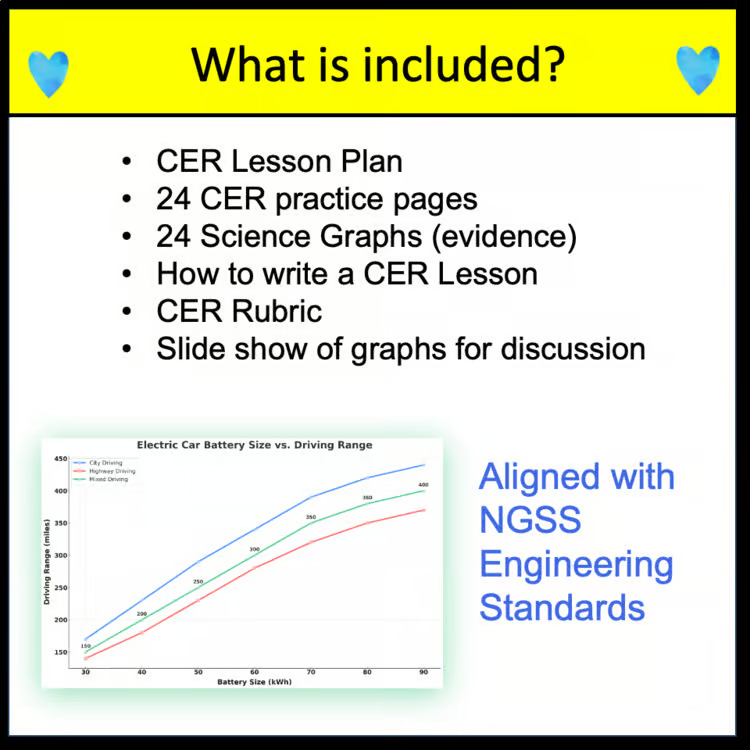
What’s Included:
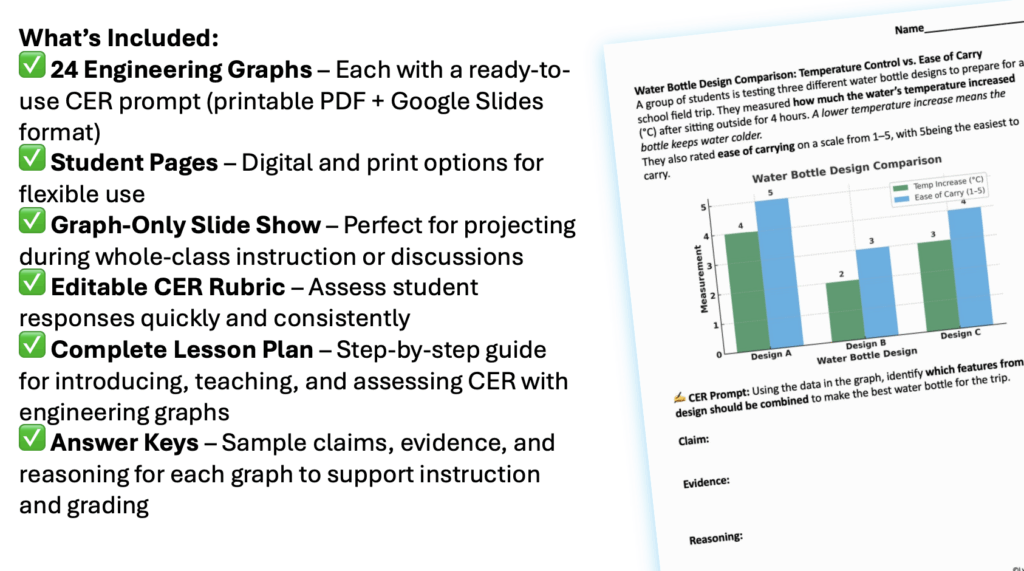
✅ 24 Engineering Graphs – Each with a ready-to-use CER prompt (printable PDF + Google Slides format)
✅ Student Pages – Digital and print options for flexible use
✅ Graph-Only Slide Show – Perfect for projecting during whole-class instruction or discussions
✅ Editable CER Rubric – Assess student responses quickly and consistently
✅ Complete Lesson Plan – Step-by-step guide for introducing, teaching, and assessing CER with engineering graphs
✅ Answer Keys – Sample claims, evidence, and reasoning for each graph to support instruction and grading
Skills Students Will Practice:
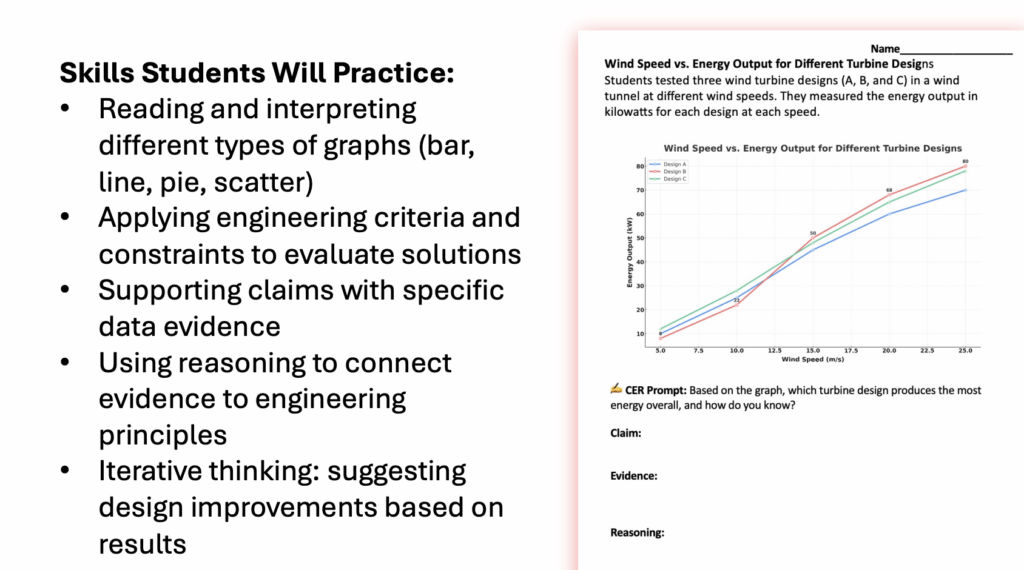
- Reading and interpreting different types of graphs (bar, line, and pie)
- Applying engineering criteria and constraints to evaluate solutions
- Supporting claims with specific data evidence
- Using reasoning to connect evidence to engineering principles
- Iterative thinking: suggesting design improvements based on results
Perfect For:
- NGSS Engineering Design standards (3–5 ETS1, MS ETS1)
- STEM classes and engineering units
- Data interpretation practice
- Test prep for science assessments involving graphs and real-world data
- Sub plans, bell ringers, small-group analysis, or project-based learning
Standards Alignment:
- Elementary: 3–5-ETS1-1, 3–5-ETS1-2, 3–5-ETS1-3
- Middle School: MS-ETS1-1, MS-ETS1-2, MS-ETS1-3, MS-ETS1-4
Why Teachers Love It:
No prep needed, print or assign digitally! The variety of engineering topics keeps students engaged, while the consistent CER structure builds strong science communication skills. The included rubric and answer keys save you time and make grading straightforward.
Graph Pages & Standards Alignment
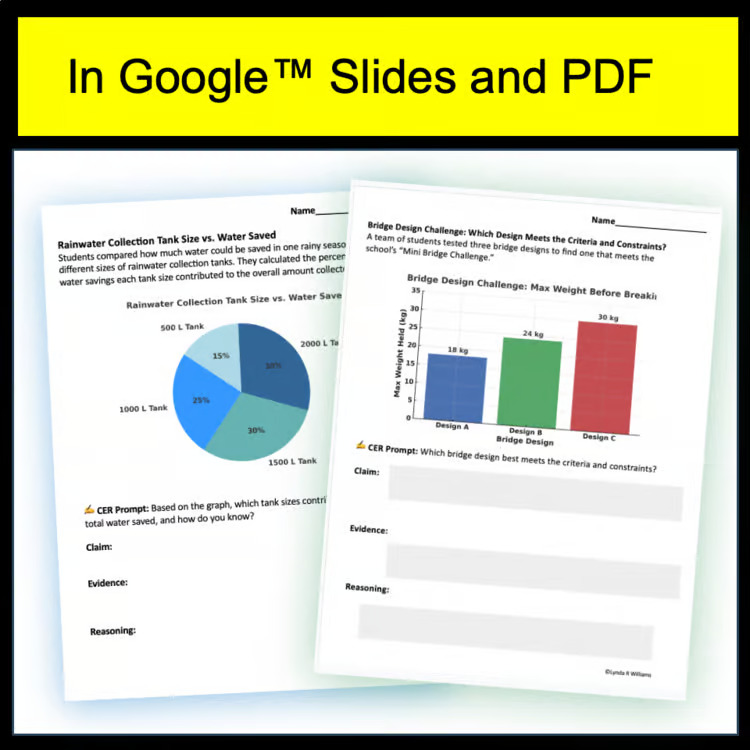
Bridge Design Challenge – Weight Supported
3–5-ETS1-1, 3–5-ETS1-2, 3–5-ETS1-3
MS-ETS1-1, MS-ETS1-2, MS-ETS1-3
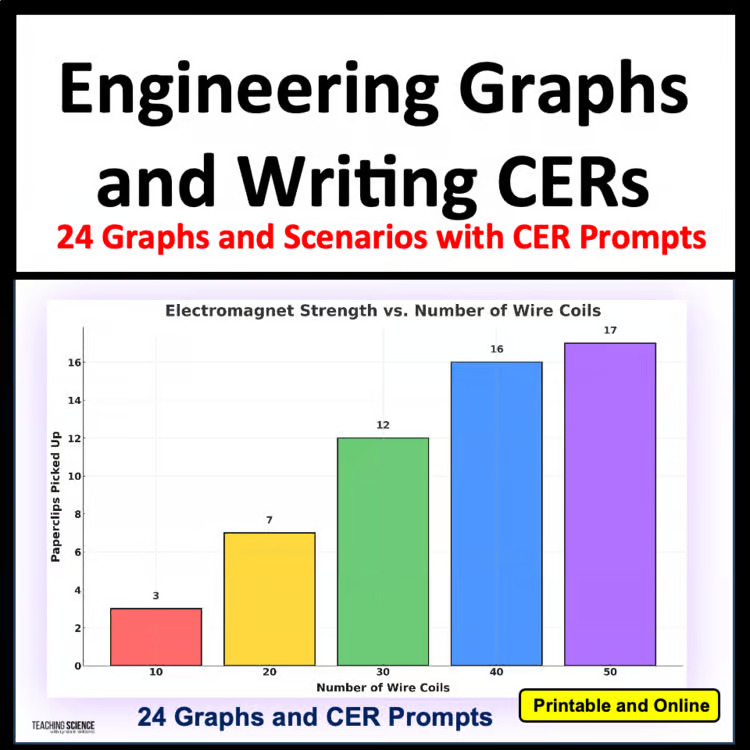
Electromagnetic Strength vs. Number of Wire Coils
3–5-ETS1-2, 3–5-ETS1-3
MS-ETS1-2, MS-ETS1-3
Ramp Slope vs. Car Travel Distance
3–5-ETS1-2, 3–5-ETS1-3
MS-ETS1-2, MS-ETS1-3
Insulation Test: Temperature Change vs. Insulation Material
3–5-ETS1-1, 3–5-ETS1-2, 3–5-ETS1-3
MS-ETS1-1, MS-ETS1-2, MS-ETS1-3
Temperature Change vs. Time for Different Materials
3–5-ETS1-2, 3–5-ETS1-3
MS-ETS1-2, MS-ETS1-3
Parachute Drop Time vs. Canopy Size
3–5-ETS1-2, 3–5-ETS1-3
MS-ETS1-2, MS-ETS1-3
Windmill Blade Number vs. Voltage Output
3–5-ETS1-2, 3–5-ETS1-3
MS-ETS1-2, MS-ETS1-3
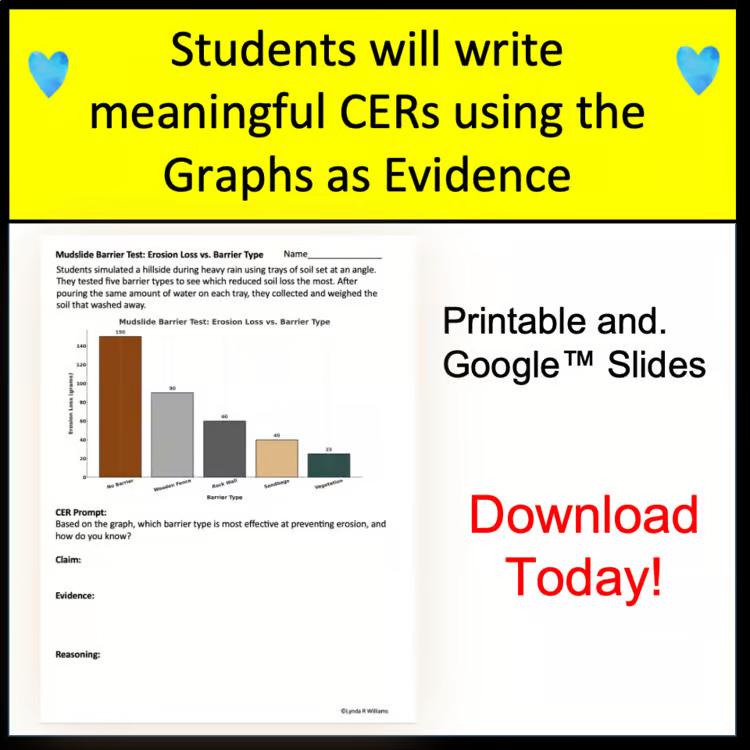
Mudslide Barrier Test: Erosion Loss vs. Barrier Type
3–5-ETS1-1, 3–5-ETS1-2, 3–5-ETS1-3
MS-ETS1-1, MS-ETS1-2, MS-ETS1-3
Oil Spill Cleanup Efficiency vs. Material Used
3–5-ETS1-1, 3–5-ETS1-2, 3–5-ETS1-3
MS-ETS1-1, MS-ETS1-2, MS-ETS1-3
Water Filtration Rate vs. Filter Material
3–5-ETS1-1, 3–5-ETS1-2, 3–5-ETS1-3
MS-ETS1-1, MS-ETS1-2, MS-ETS1-3
Water Bottle Design Comparison: Temperature Control vs. Ease of Carry
3–5-ETS1-1, 3–5-ETS1-2, 3–5-ETS1-3
MS-ETS1-1, MS-ETS1-2, MS-ETS1-3
Paper Airplane Flight Distance Over Iterative Designs
3–5-ETS1-3
MS-ETS1-3, MS-ETS1-4
Wind Turbine Blade Test Results
3–5-ETS1-1, 3–5-ETS1-2, 3–5-ETS1-3
MS-ETS1-1, MS-ETS1-2, MS-ETS1-3
Roof Shape vs. Snow Load Support
3–5-ETS1-2
Coastal Flood Wall Height vs. Water Overflow Rate
3–5-ETS1-1, 3–5-ETS1-2, 3–5-ETS1-3
MS-ETS1-1, MS-ETS1-2, MS-ETS1-3
Bridge Deck Material vs. Maximum Load Supported
3–5-ETS1-2, 3–5-ETS1-3
MS-ETS1-2, MS-ETS1-3
Helmet Design vs. Impact Force Absorbed
3–5-ETS1-2, 3–5-ETS1-3
MS-ETS1-2, MS-ETS1-3
Road Surface Type vs. Vehicle Stopping Distance
3–5-ETS1-2, 3–5-ETS1-3
MS-ETS1-2, MS-ETS1-3
Solar Panel Angle vs. Electricity Generated
3–5-ETS1-2, 3–5-ETS1-3
MS-ETS1-2, MS-ETS1-3
Drone Payload Weight vs. Flight Time
3–5-ETS1-2, 3–5-ETS1-3
MS-ETS1-2, MS-ETS1-3
Electric Car Battery Size vs. Driving Range
3–5-ETS1-2, 3–5-ETS1-3
MS-ETS1-2, MS-ETS1-3
Wind Speed vs. Energy Output for Different Turbine Designs
3–5-ETS1-2, 3–5-ETS1-3
MS-ETS1-2, MS-ETS1-3
Green Roof Coverage vs. Building Temperature Reduction
3–5-ETS1-2, 3–5-ETS1-3
MS-ETS1-2, MS-ETS1-3
Rainwater Collection Tank Size vs. Water Saved
3–5-ETS1-1, 3–5-ETS1-2, 3–5-ETS1-3
MS-ETS1-1, MS-ETS1-2, MS-ETS1-3
Check out my blog post on helping students master CER with graph based practice!