
Description
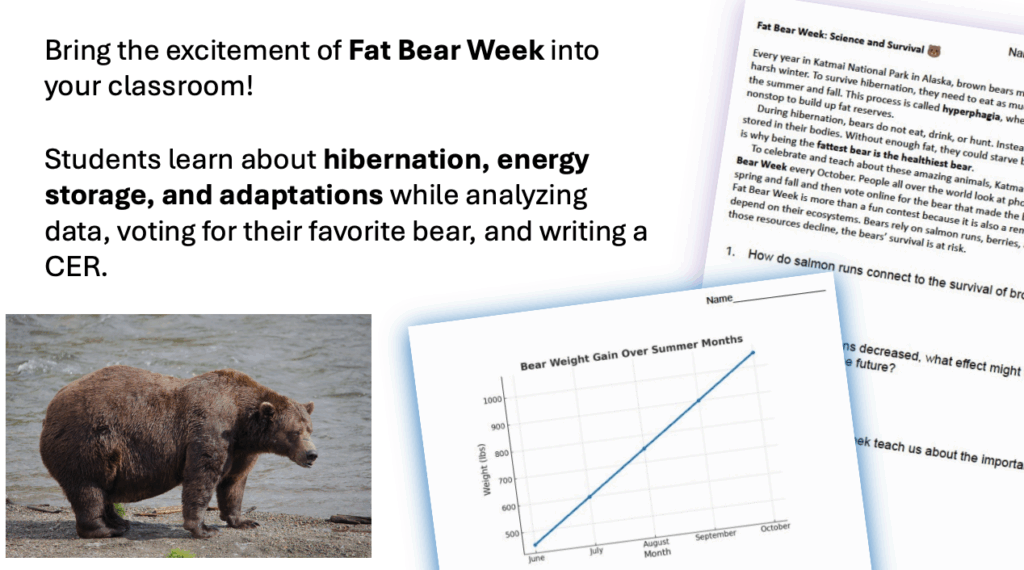
Bring the excitement of Fat Bear Week into your classroom! Students learn about hibernation, energy storage, and adaptations while analyzing data, voting for their favorite bear, and analyzing graphs. Perfect for teaching NGSS Science & Engineering Practices, students observe, compare, and use evidence just as real scientists do.
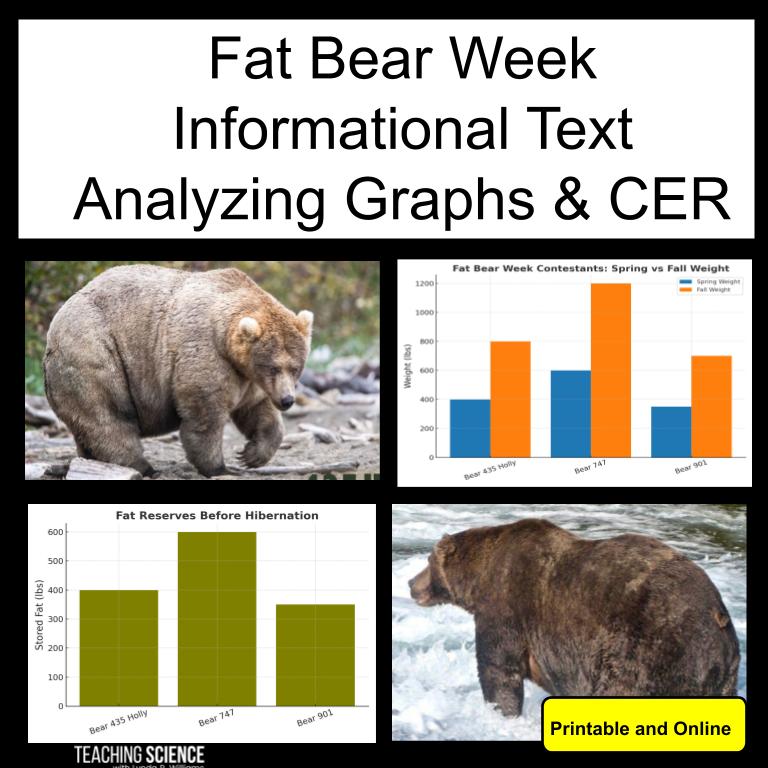
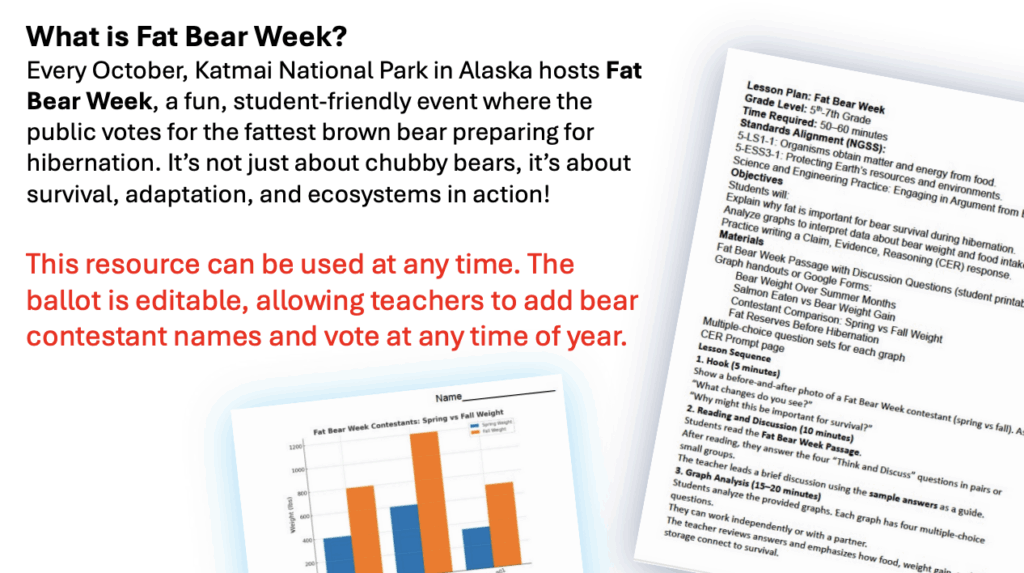
Every October, Katmai National Park in Alaska hosts Fat Bear Week, a fun, student-friendly event where the public votes for the fattest brown bear preparing for hibernation. It’s not just about chubby bears, it’s about survival, adaptation, and ecosystems in action! The official event takes place in October, but this resource can be used any time of year!
This resource brings Fat Bear Week into your classroom to spark excitement while teaching key scientific concepts. Students will learn how bears accumulate fat reserves for hibernation, why body mass is crucial for survival, and how scientists (and students!) can use data, graphs, and observation to analyze animal adaptations.
This resource is designed with flexibility so that it can be used every year, regardless of which bears are in the contest.
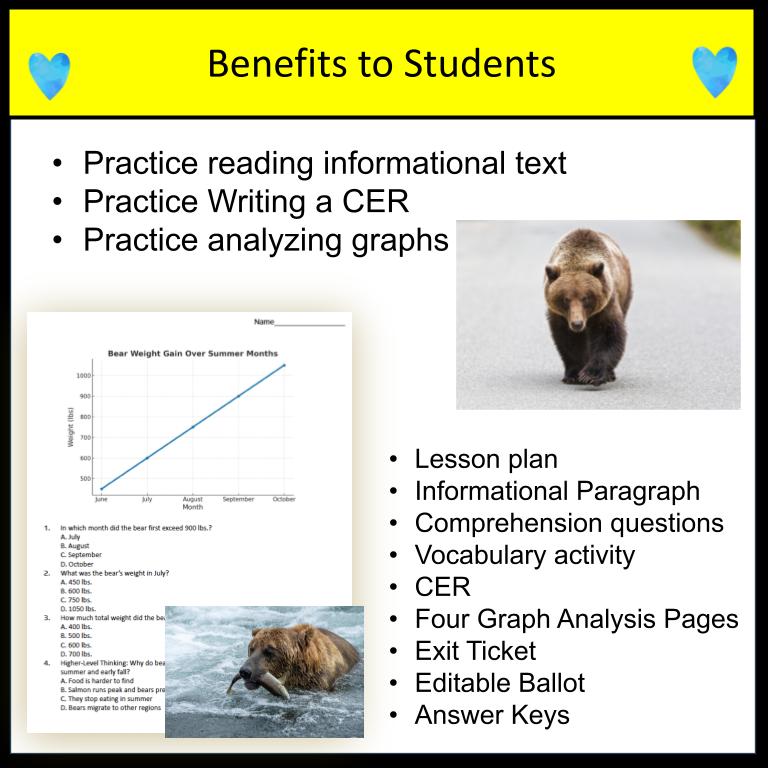
What’s Included:
✅ Editable Fat Bear Ballot – let your students vote for their favorite bear! (Printable and Google Form)
✅ Graphing & Data Activities – Analyze graphs (printable and Google Forms)
✅ Discussion Questions – connect Fat Bear Week to NGSS science practices.
✅ Lesson Plan and Teacher Guide – background information on Fat Bear Week and bear biology.
✅ CER Writing Prompt for claim–evidence–reasoning practice. (Printable and Google Slides)
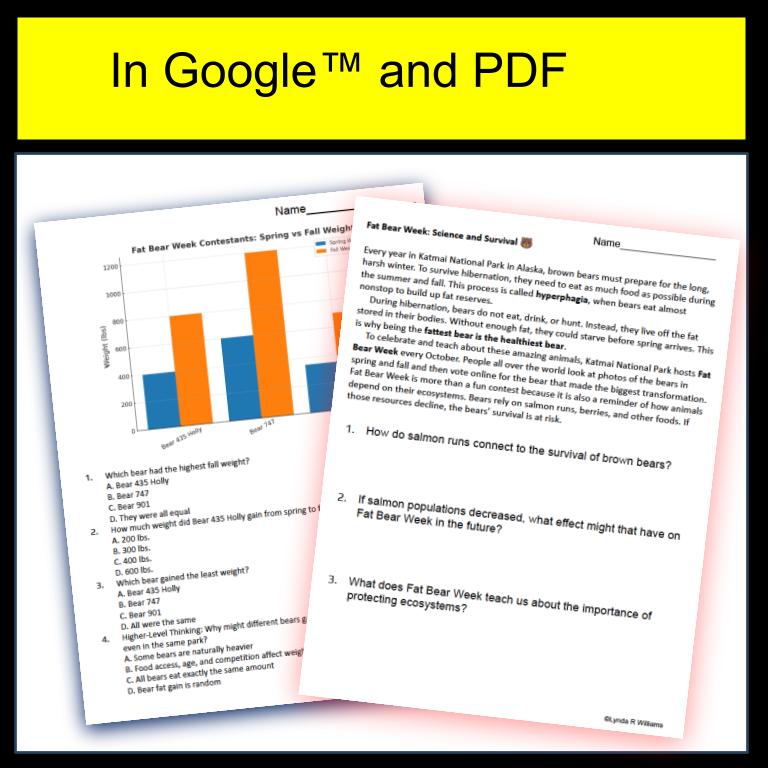
✅ Paragraph to Read with comprehension questions (Printable and Google Slides)
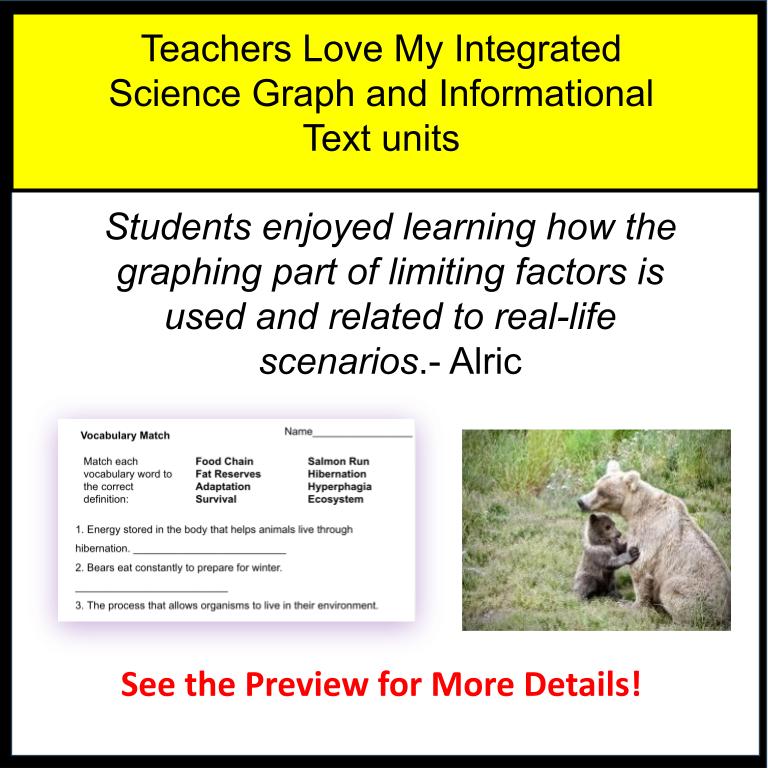
✅Vocabulary Activity (Printable and Google Slides)
Science Concepts Covered:
- Adaptations & survival strategies (hibernation, energy storage)
- Ecosystem interactions and food chains
- Graphing and data analysis
- Scientific practices: observing, comparing, and using evidence
Why Teachers Love It:
This resource takes a real-world phenomenon that students already find fascinating and turns it into a critical thinking science lesson. Students practice analyzing data, making claims with evidence, and connecting concepts such as energy transfer, food webs, and seasonal changes, all while having fun with adorable (and very plump) bears!
Check out my blog post on helping students master CER with graph based practice!