


Description
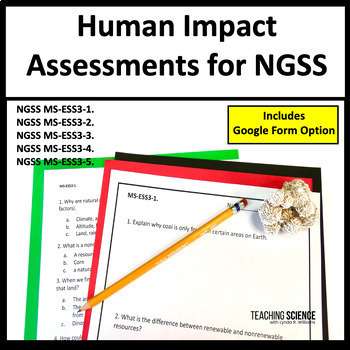
This is a set of assessments and quizzes for Human Impact on the environment. This resource includes printable assessments and Google form quizzes. Use this to assess at the end of each unit or as test prep at the end of the year. This covers all 5 Human Impact standards for NGSS Middle School. There are multiple-choice and short-answer questions. ✅
Human Impact Assessments Include:
- Printable PDF assessments for each standard
- Five Google Form Assessments (one for each standard)
- Answer Keys
Teachers Love My Assessments!!! ❤️❤️❤️
Jennifer ⭐️ ⭐️ ⭐️ ⭐️ ⭐️ These quizzes were perfect for assessing and for test review before the big state test. I used the google forms in google classroom, but I used the pdf for a practice test. Both were useful and accurate. It was nice to have options.
Jack ⭐️ ⭐️ ⭐️ ⭐️ ⭐️ Getting ready for spring testing and these assessments were helpful for prep and practice.
Standards Addressed:
MS-ESS3-1.
Construct a scientific explanation based on evidence for how the uneven distributions of Earth’s mineral, energy, and groundwater resources are the result of past and current geoscience processes.
Utah SEEd Standard 8.4.1
Construct a scientific explanation based on evidence that shows that the uneven distribution of Earth’s mineral, energy, and groundwater resources is caused by geological processes. Examples of uneven distribution of resources could include Utah’s unique geologic history that led to the formation and irregular distribution of natural resources like copper, gold, natural gas, oil shale, silver, and uranium. (ESS3.A)
NGSS MS-ESS3-2.
Analyze and interpret data on natural hazards to forecast future catastrophic events and inform the development of technologies to mitigate their effects.
Utah SEEd Standard 8.4.5
Analyze and interpret patterns of the occurrence of natural hazards to forecast future catastrophic events, and investigate how data is used to develop technologies to mitigate their effects. Emphasize how some natural hazards, such as volcanic eruptions and severe weather, are preceded by phenomena that allow prediction, but others, such as earthquakes, may occur without warning. (ESS3.B)
MS ESS3-3 Apply scientific principles to design a method for monitoring and minimizing a human impact on the environment.
Utah SEEd Standard 8.4.3
Design a solution to monitor or mitigate the potential effects of the use of natural resources. Evaluate competing design solutions using a systematic process to determine how well each solution meets the criteria and constraints of the problem. Examples of uses of the natural environment could include agriculture, conservation efforts, recreation, solar energy, and water management. (ESS3.A, ESS3.C, ETS1.A, ETS1.B, ETS1.C)
MS-ESS3-4 Construct an argument supported by evidence for how increases in human population and per-capita consumption of natural resources impact Earth’s systems.
Utah SEEd Standard 8.4.2
Engage in argument supported by evidence about the effect of per-capita consumption of natural resources on Earth’s systems. Emphasize that these resources are limited and may be non-renewable. Examples of evidence include rates of consumption of food and natural resources such as freshwater, minerals, and energy sources. (ESS3.A, ESS3.C)
This resource is specially designed to teach the standards
NGSS MS-ESS3-5. Ask questions to clarify evidence of the factors that have caused the rise in global temperatures over the past century.
Utah SEEd Standard 6.3.4 Construct an explanation supported by evidence for the role of the natural greenhouse effect in Earth’s energy balance, and how it enables life to exist on Earth. Examples could include comparisons between Earth and other planets such as Venus and Mars. – From the Utah Core.
This resource is also aligned with Utah SEEd standard 8.4.4
Analyze and interpret data on the factors that change global temperatures and their effects on regional climates. Examples of factors could include agricultural activity, changes in solar radiation, fossil fuel use, and volcanic activity. Examples of data could include graphs of the atmospheric levels of gases, seawater levels, ice cap coverage, human activities, and maps of global and regional temperatures. (ESS3.D)