
Description
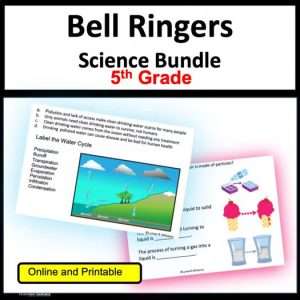
Science Graph Bell Ringers for 3rd–5th Grade!
Make science data analysis quick, engaging, and stress-free with these 5-minute daily graph bell ringers! Perfect for upper elementary (3rd–5th grade), this resource gives your students consistent practice interpreting real-world science data in just a few minutes a day.
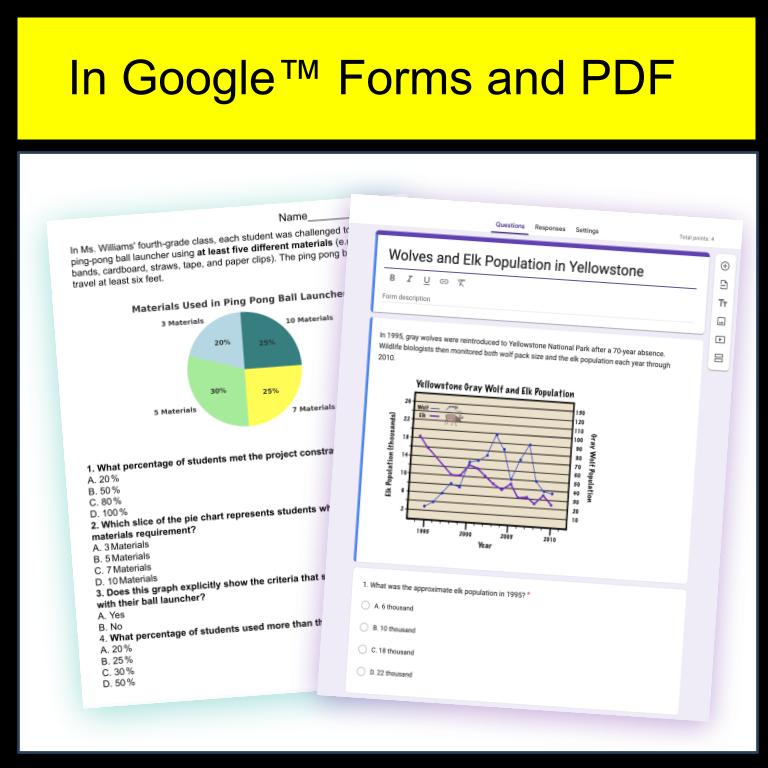
This set includes 21 ready-to-use graphing activities in both printable format and self-checking Google Forms. Each bell ringer features:
- A student-friendly graph (bar, line, dot plot, or pie chart)
- Four multiple-choice questions that can be answered by simply reading the graph
- Questions aligned to NGSS across physical science, life science, earth science, and engineering
Your students will practice key Science and Engineering Practices (SEPs) such as analyzing and interpreting data, identifying patterns, and constructing evidence-based claims. At the same time, you save time on planning and grading.
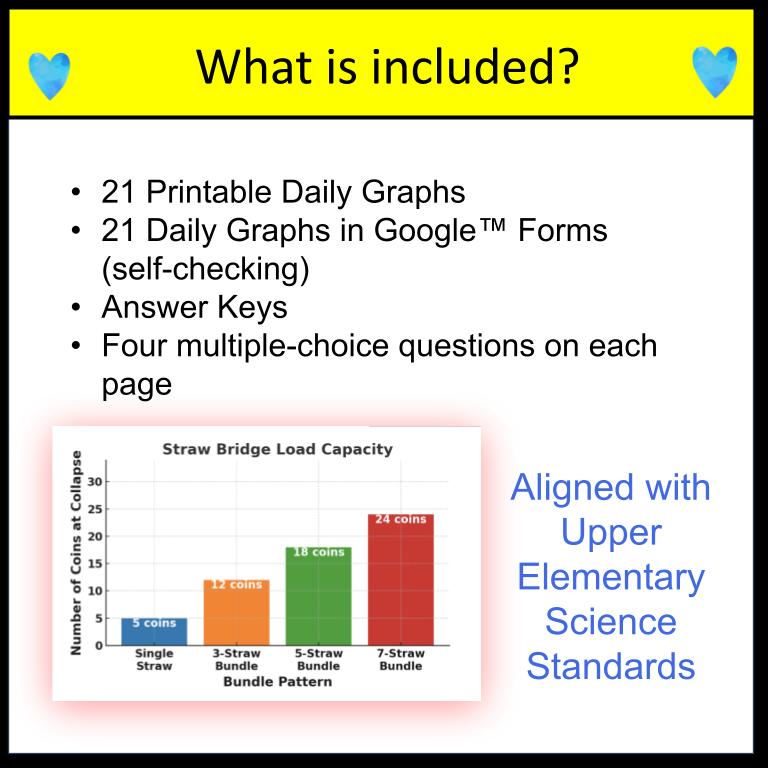
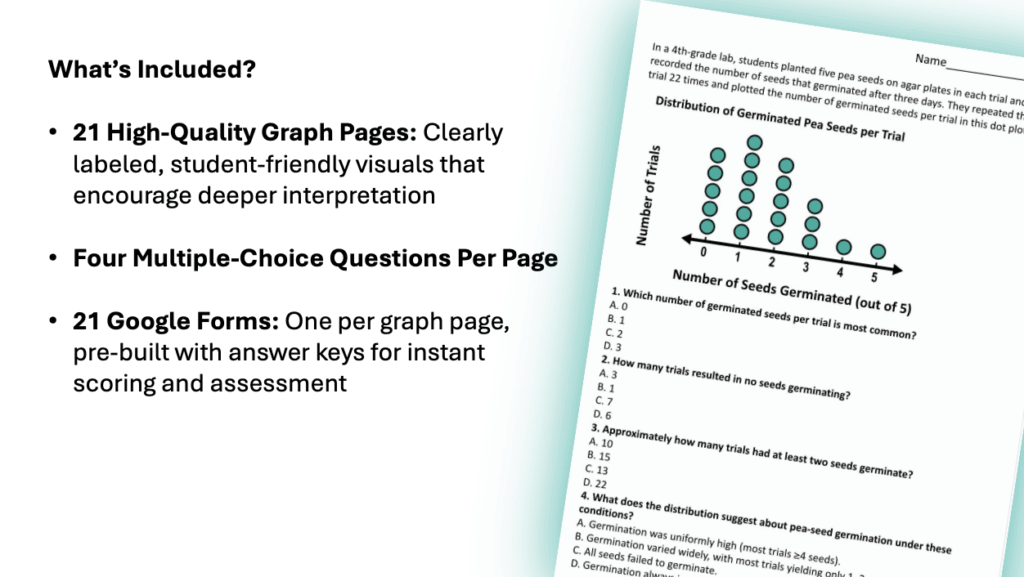
✨ What’s Included:
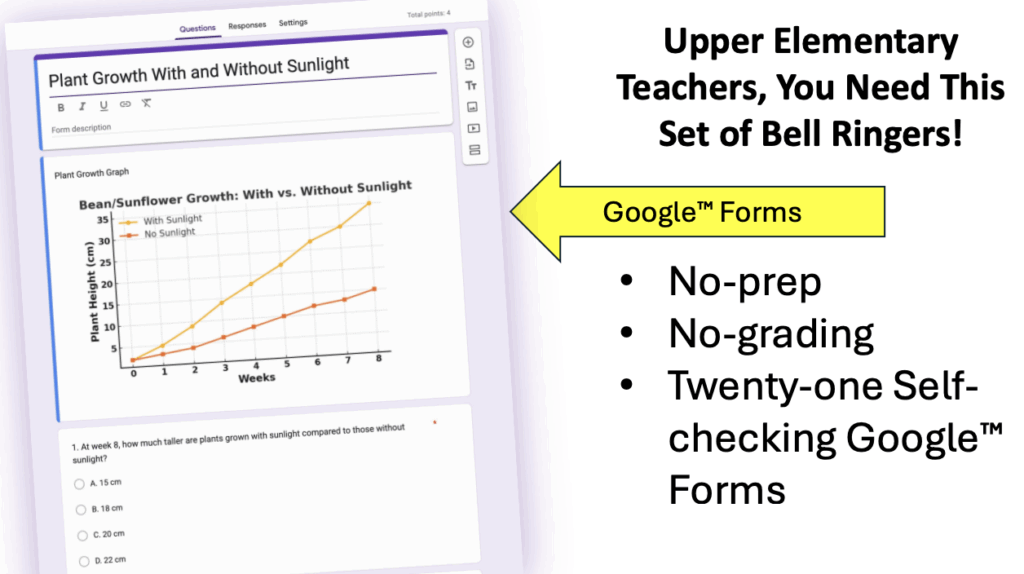
- 21 Graph Bell Ringers (Printable PDF)
- 21 Matching Google Forms (self-checking for no grading!)
- Coverage of NGSS-aligned 3rd–5th grade science concepts (forces & motion, ecosystems, plant growth, engineering design, and more)
Perfect for:
- Daily warm-ups / bell ringers
- Quick exit tickets
- Test prep practice
- Partner or small group review
- Emergency sub plans
With no prep required, these graphing activities are the easiest way to build student confidence in data analysis and scientific thinking, all while fitting seamlessly into your 5-minute warm-up routine.
List of Graphs with NGSS Alignment
- Breaking Strength of Materials – 3-PS2-1 (Balanced & unbalanced forces on motion)
- Wolves and Elk Population in Yellowstone – 5-LS2-1 (Movement of matter in ecosystems)
- Ramp Angle vs. Distance Traveled – 3-PS2-2 (Patterns of motion)
- Mixer Energy Use – Engineering Prototype Comparison – 3-PS2-4 (Magnetism & design problems)
- Straw Bundle Strength (Load-Bearing Test) – 3-5-ETS1-3 (Fair tests, controlled variables, failure points)
- Balloon Tower Stability (Sandbag Test) – 3-5-ETS1-3 (Fair tests, controlled variables, failure points)
- Boat Penny Floatation Trials – 3-5-ETS1-2 (Generate and compare solutions)
- Ping Pong Ball Launcher – Materials Used – 3-5-ETS1-1 (Define a simple design problem)
- Paper Airplane Distance Comparison – 3-5-ETS1-3 (Fair tests, controlled variables, failure points)
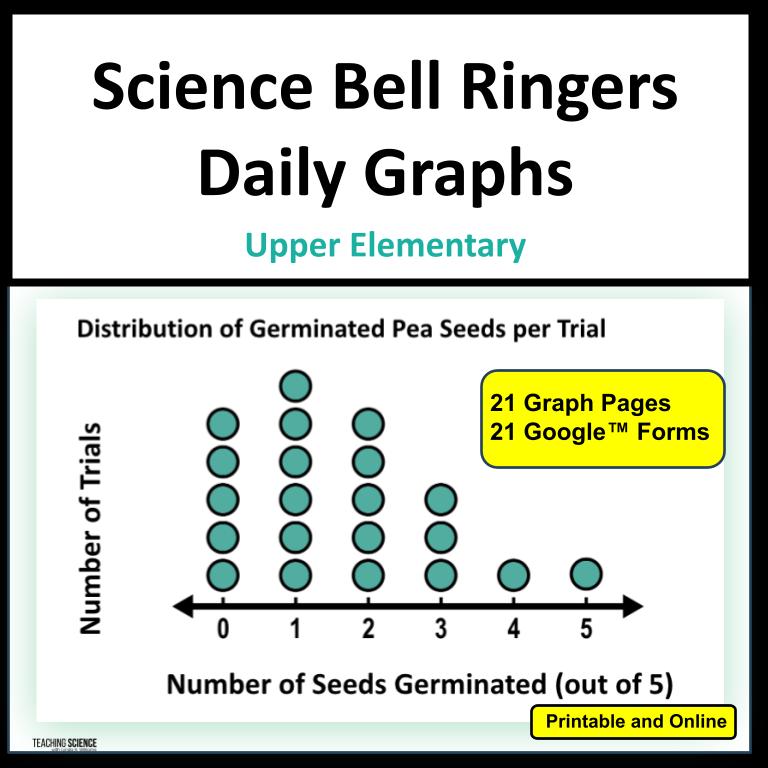
- Pea Seed Germination Distribution – 5-LS1-1 (Plants obtain materials for growth from air and water)
- Prototype Vehicle Distance Testing – 3-PS2-2 (Patterns of motion)
- Paper Airplane Weight vs. Flight Distance – 3-5-ETS1-3 (Fair tests, controlled variables, failure points)
- Garden Fence Height vs. Plant Damage – 3-LS4-4 (Merit of solutions to environmental changes)
- Project Type Selection (Pie Chart: Science vs. Engineering vs. Service) – Crosscutting Concepts / Data interpretation (Math integration)
- Toy Car Distance on Different Surfaces – 3-PS2-2 (Patterns of motion)
- Bridge Materials Distribution (Pie Chart) – 3-5-ETS1-1 (Define a simple design problem)
- Two People Walking – One Stops to Tie a Shoe – 3-PS2-2 (Patterns of motion, interpreting motion graphs)
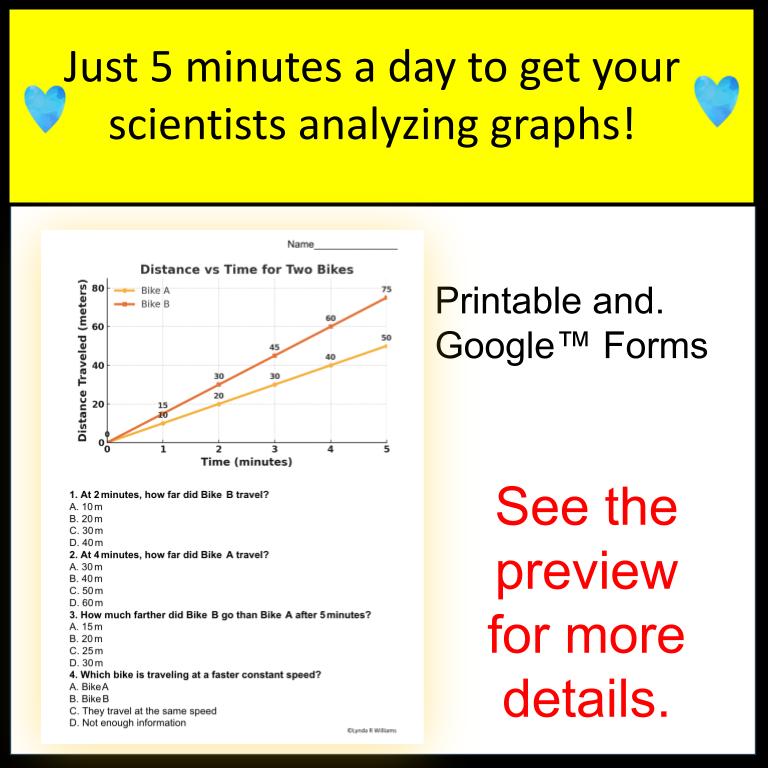
- Bike Speed Over Time Comparison – 3-PS2-2 (Patterns of motion)
- Plant Growth With and Without Sunlight – 5-LS1-1 (Plants obtain materials for growth from air and water)
- Ecosystem Trophic Levels (Producers, Consumers, Decomposers) – 5-LS2-1 (Movement of matter in ecosystems)
- Species A vs. Species B Population Change Over Time – 3-LS4-3 (Survival in habitats)
Check out my blog post on helping students master CER with graph based practice!