If your middle school science class needs practice analyzing graphs, this group of science graph worksheets will save you lots of time and effort! Your middle school science scholars will love using this resource and you will too! This is no prep for you! Just print and go, or use the Google Pages. Students will be thinking critically about all kinds of data in no time!
This set of worksheets includes 25 different pages of science graphs with questions!
You will also receive a link to a digital version of the worksheets via Google Slides. Accessing the digital version is easy – just scroll to the 2nd page of the resource, click the link to Google Slides, and a new copy of the resource will be copied to your Google Drive. This can be used in Google Classroom or just share the link provided. You will get booth the printable PDF and the Google links.
These worksheets are great for both science test prep and for promoting critical thinking! Students will need to study the graph, look back at the graph and think critically to answer the questions. This is very similar to what they will be required to do on state testing. This is excellent practice and test prep.
The graphs and worksheets address a wide variety of topics:
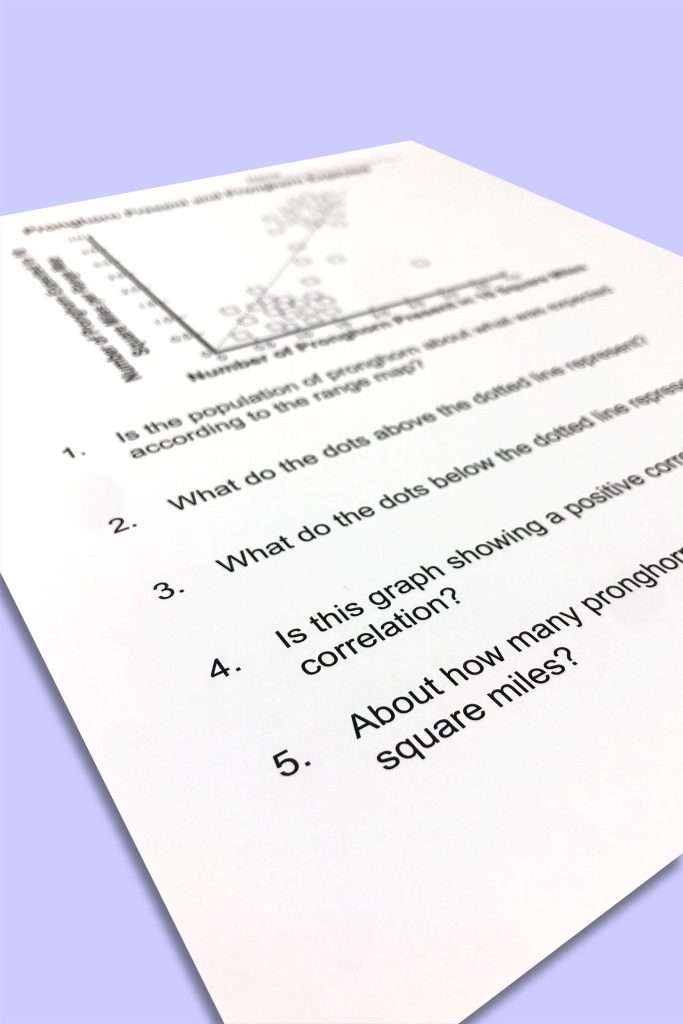
- Scatter Plot Pronghorn Population vs. Expected Population
- Scatter Plot Time on Video Games Compared to Scores on Test
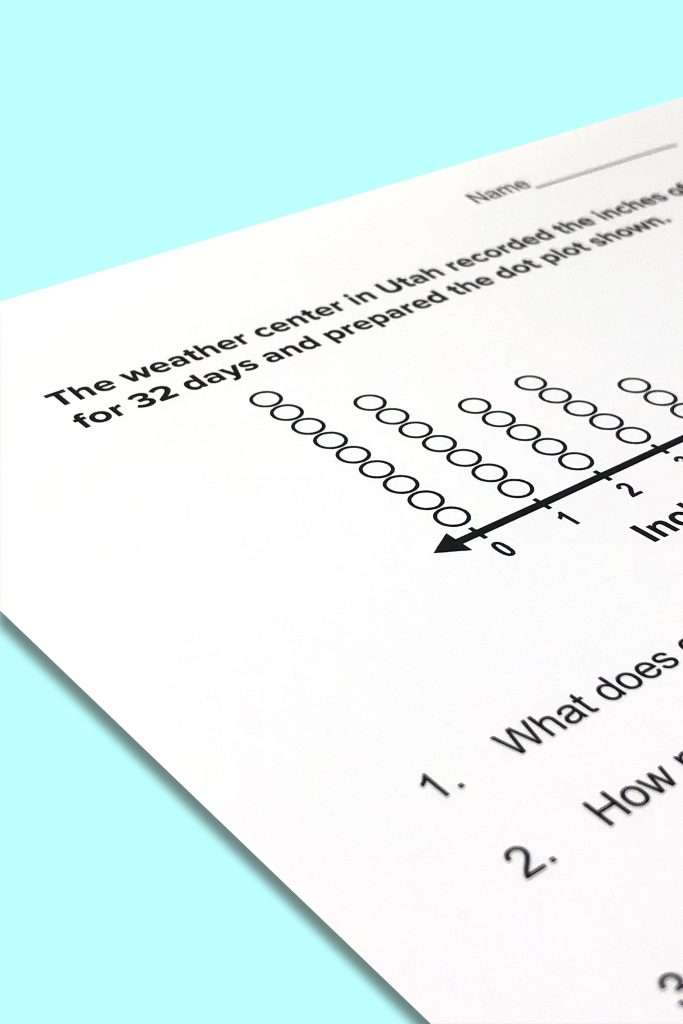
- Dot Plot- Weather In Utah
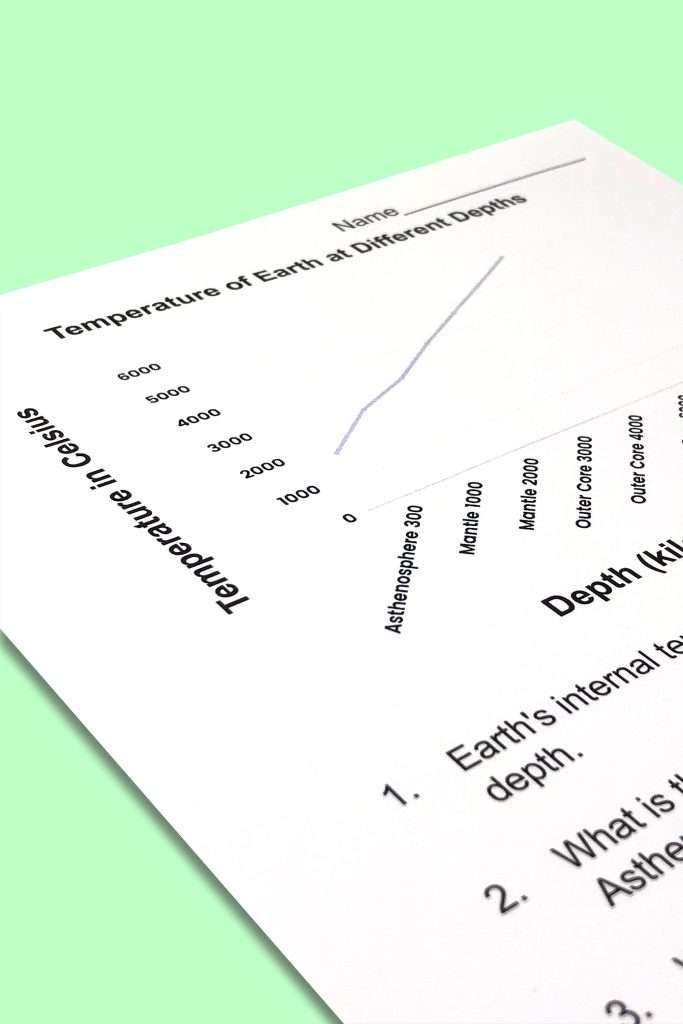
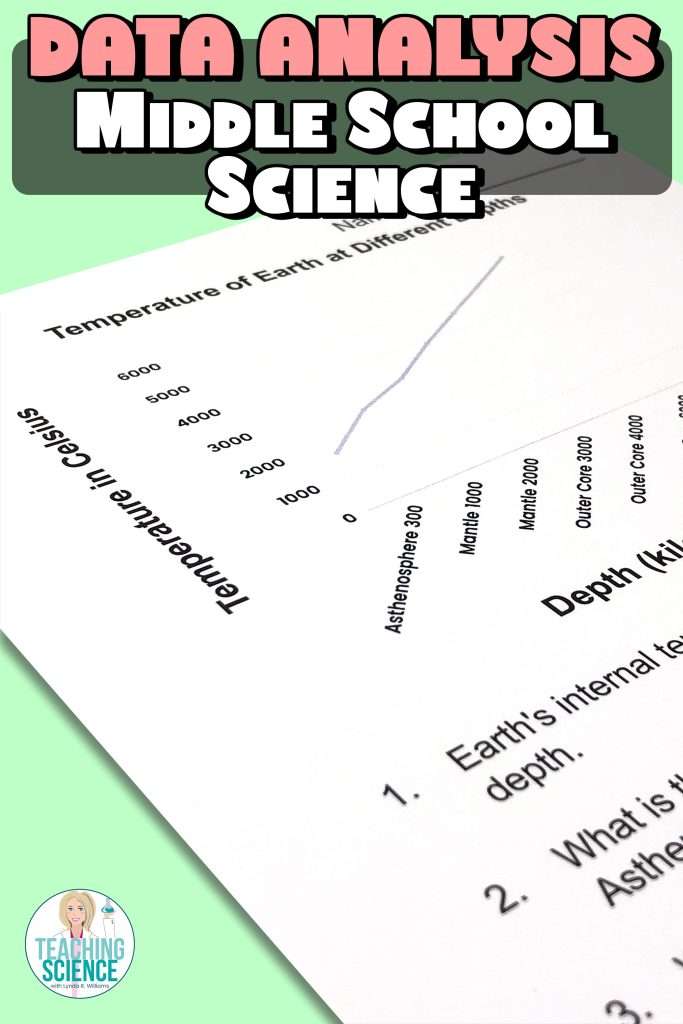
- Line Graph Temperature of Earth at Different Depths
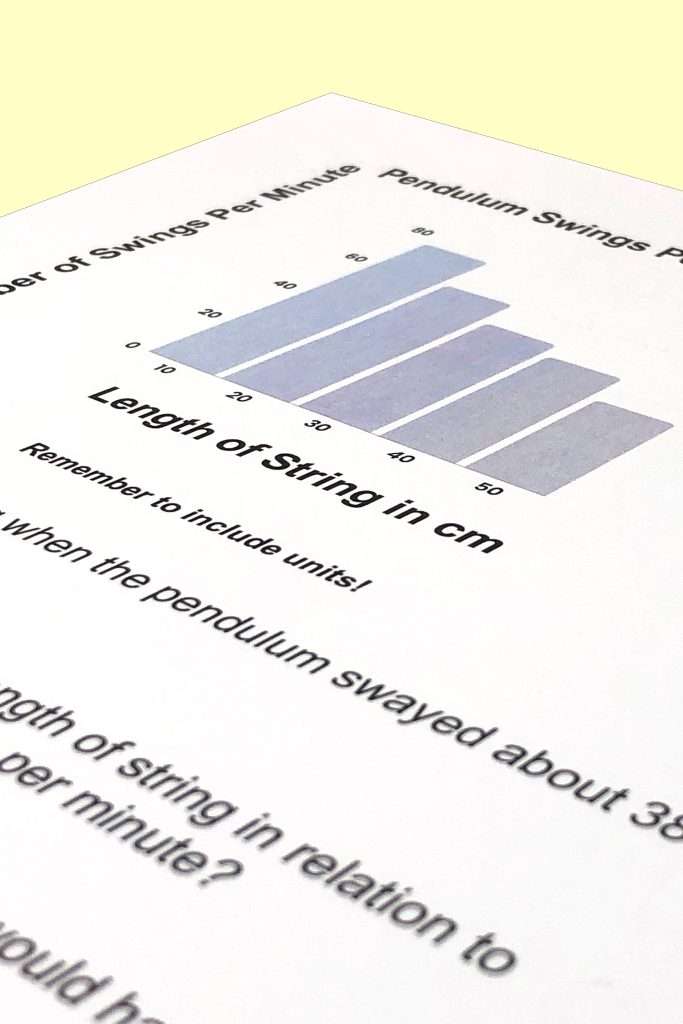
- Bar Graph Pendulum Swings Per Minute with 150 g Weight
- Line Graph Distance Marble rolled with Different Ramp Heights
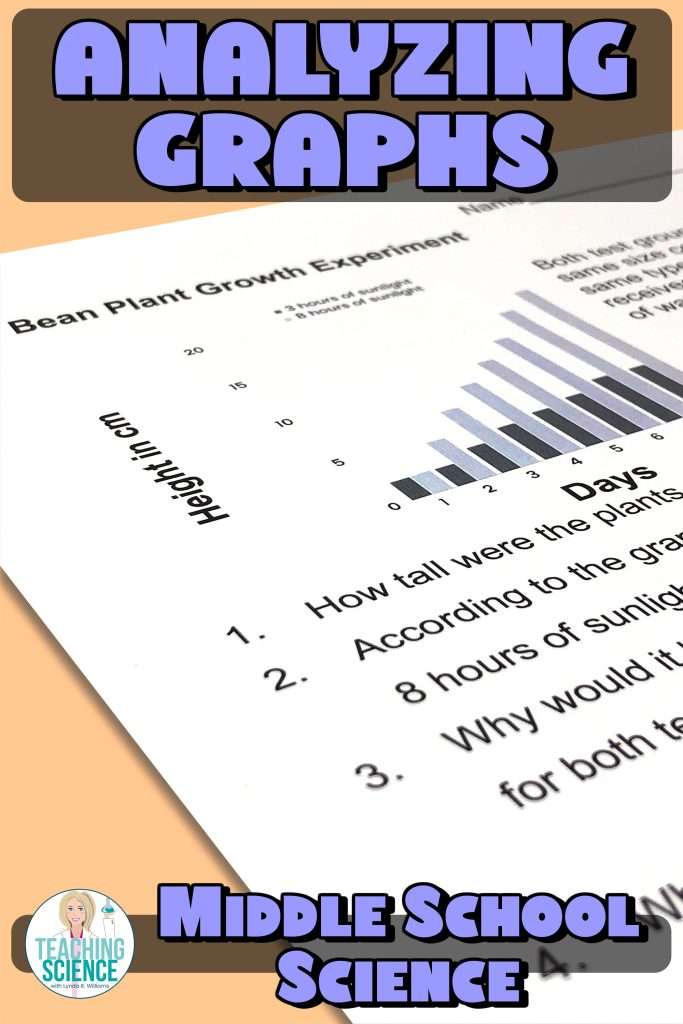
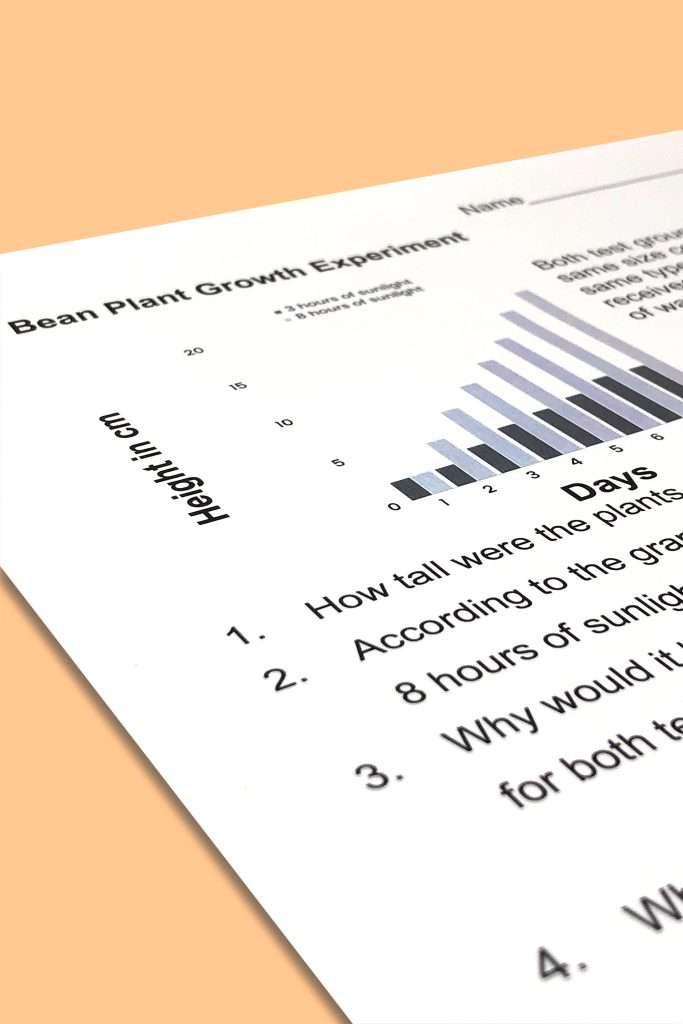
- Double Bar Graph Bean Plant Growth Experiment
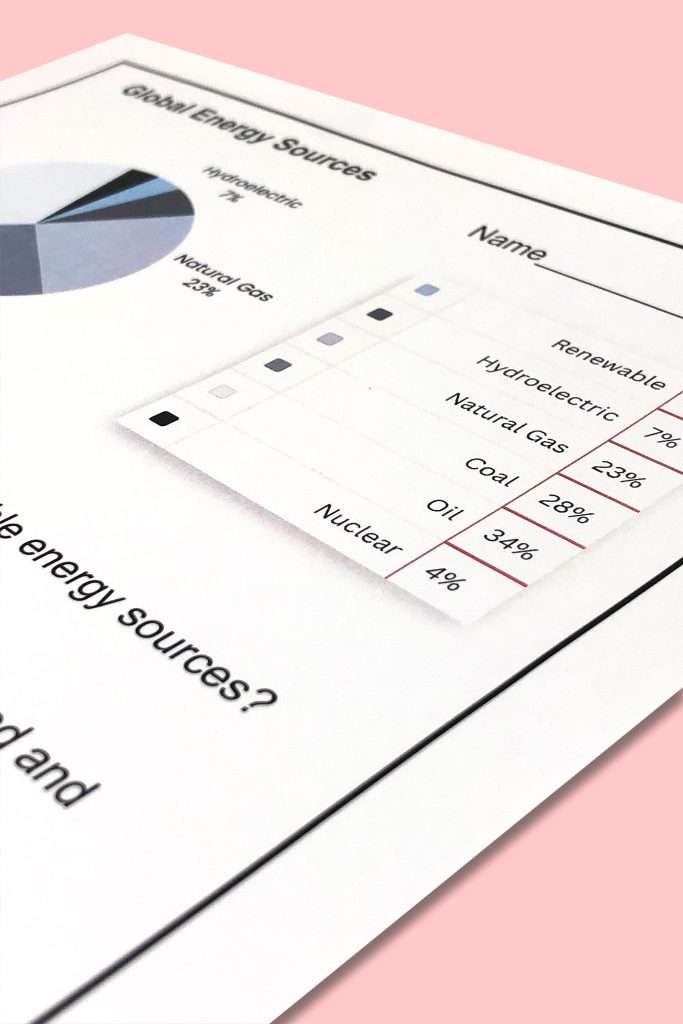
- Circle Graph Global Energy Sources
- Bar Graph Shadow Length Over Day
- Bar Graph Average Yearly Precipitation
- Line Graph Temperatures at Different Times of The Day
- Line Graph Speed of a Dog
- Line Graph Distance of Manatee Swim
- Line Graph Number of Species in an Ecosystem
- Line Graph Increase in Global Temperature
- Double Line Graph C02 Emissions and Population Growth
- Comparing Two Graphs, Correlation and Causation
- Histogram Tree Circumference
- Histogram Mass of Mule Deer in kg
- Circle Graph Mineral Composition of Green Sandstone
- Position vs. Time Graph
- Which Graph is Best To Use?
- Practice Simplified Graphing for Differentiation One (student graphing)
- Practice Simple Graphing for Differentiation Two (student graphing)
- Position vs Time Graphing Practice (student graphing)
I was able to use this right away! No prep. Can be used in Google Classroom or face to face. Great practice with graphing and analyzing graphs for science. Lots of different types of graphs.
Samantha P.
Great graphs for practice and test prep. Love the great thinking questions and the variety of science topics. I was able to walk through thinking with my students.
Adelle S.
Wow! These graphs really make my kids think and look at the graphs. I think this is outstanding! Going to look for more by this seller!
Aileen H.
Other middle school science teachers LOVE this resource!
Check out more of the perfect reviews on Teachers Pay Teachers.
Get this resource for your middle school science classroom TODAY:
This resource is available for download in two places:
Both downloads are identical in every way – if you download directly from this site, you’re giving me the maximum support!
Either way, your satisfaction is 100% guaranteed.
This site uses 100% secure checkout, and your download is instantly available after checkout.
Thank you, and I hope you enjoy using this unit in your classroom!
Get your students busy analyzing graphs and studying data. This is an important Science and Engineering Practice that is often hard to address. You will love this resource!