Do you know how to teach students to read a graph? Understanding graphs and data tables is one of the most important skills in middle school science — yet it’s also one of the hardest for students to master. Many learners can look at a graph but struggle to read what the data really says. Helping students develop confidence with graphs builds their ability to think like scientists, identify patterns, and make evidence-based claims. Teachers want to know how students can improve at reading graphs and data tables.
Below are simple, classroom-tested strategies for improving data-analysis skills — plus ready-to-use resources designed to make graph reading part of your daily routines.
1. Start with Visual Thinking, Not Vocabulary
Before teaching terms like “independent variable” or “trend,” ask students what they see.
-
What is increasing or decreasing?
-
What’s different between the lines or bars?
-
Where do they notice a change?
Encouraging observation first helps students connect visuals to meaning. Once they describe what they see, you can layer in the scientific language.
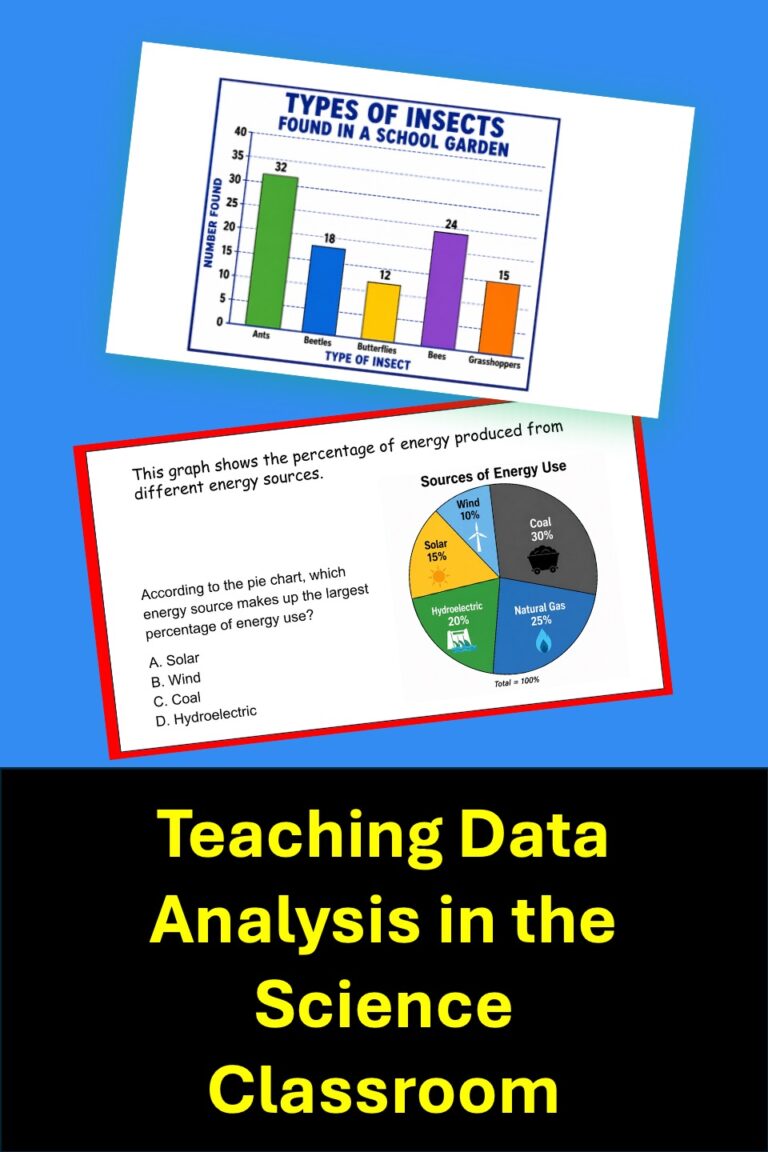
🟩 Try this: Use a simple bar graph from your unit and have students describe it in one sentence before identifying the axes. This builds visual literacy.

2. Use Short, Daily Practice
Data interpretation improves with repetition — just like reading. Instead of saving graphs for the end of a lab or test review, include a graph-a-day warm-up.
Quick, low-stakes graph questions:
-
Keep analysis fresh.
-
Expose students to multiple graph types.
-
Build confidence without extra grading.
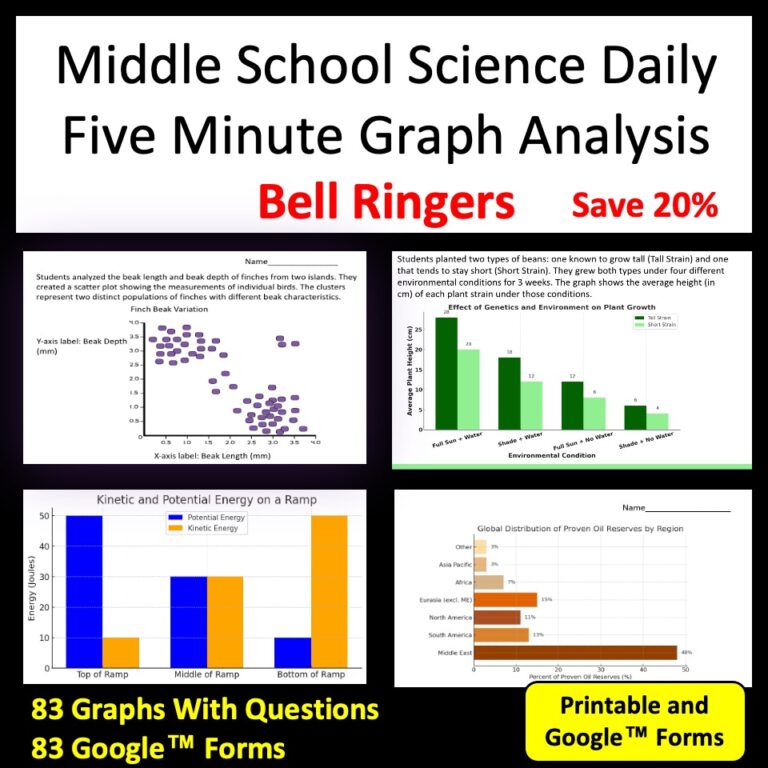
📊 My Daily Graph Bellringer resources give you five minutes of graph practice each day with auto-grading Google Forms or printable slides. Students analyze real-world data, see immediate feedback, and begin to recognize patterns naturally.
3. Model the “Three-Step Process” for Graph Analysis
Teach students to slow down and follow a consistent routine:
-
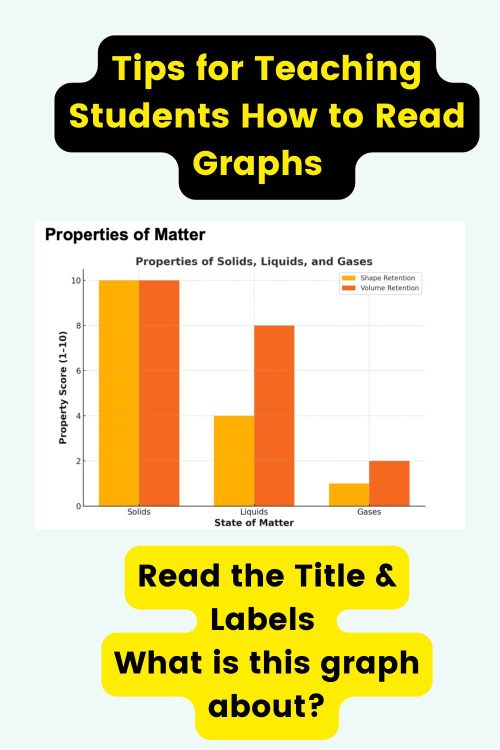
Read the Title & Labels — What is this graph about?
-
Describe the Data — What happens as one variable changes?
-
Draw a Conclusion — What claim can you make from this pattern?
Posting these steps as a class anchor chart or reference card helps students internalize the process.
🧠 Pro Tip: Have students highlight key words in the title and axis labels before answering questions. Visual cues reinforce comprehension.
4. Connect Graphs to Real Phenomena
Graphs make sense when they connect to real experiences. Use examples students can picture:
-
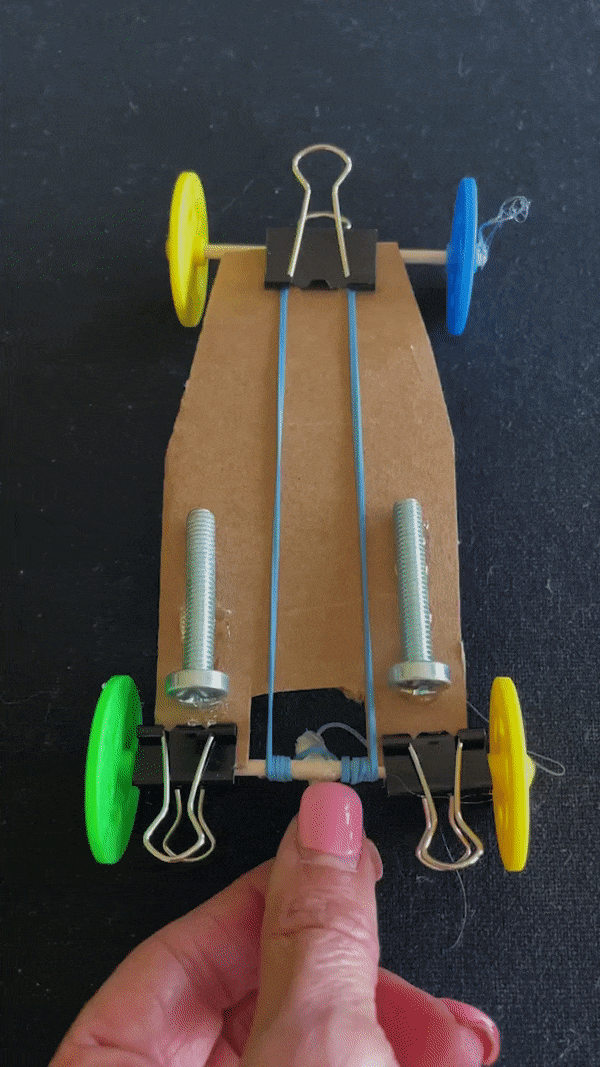
Speed of a toy car rolling down different ramps
-
Population changes in wolves and elk
-
Temperature changes during a day at school
When data feels authentic, students engage more deeply and remember the concept behind the numbers.
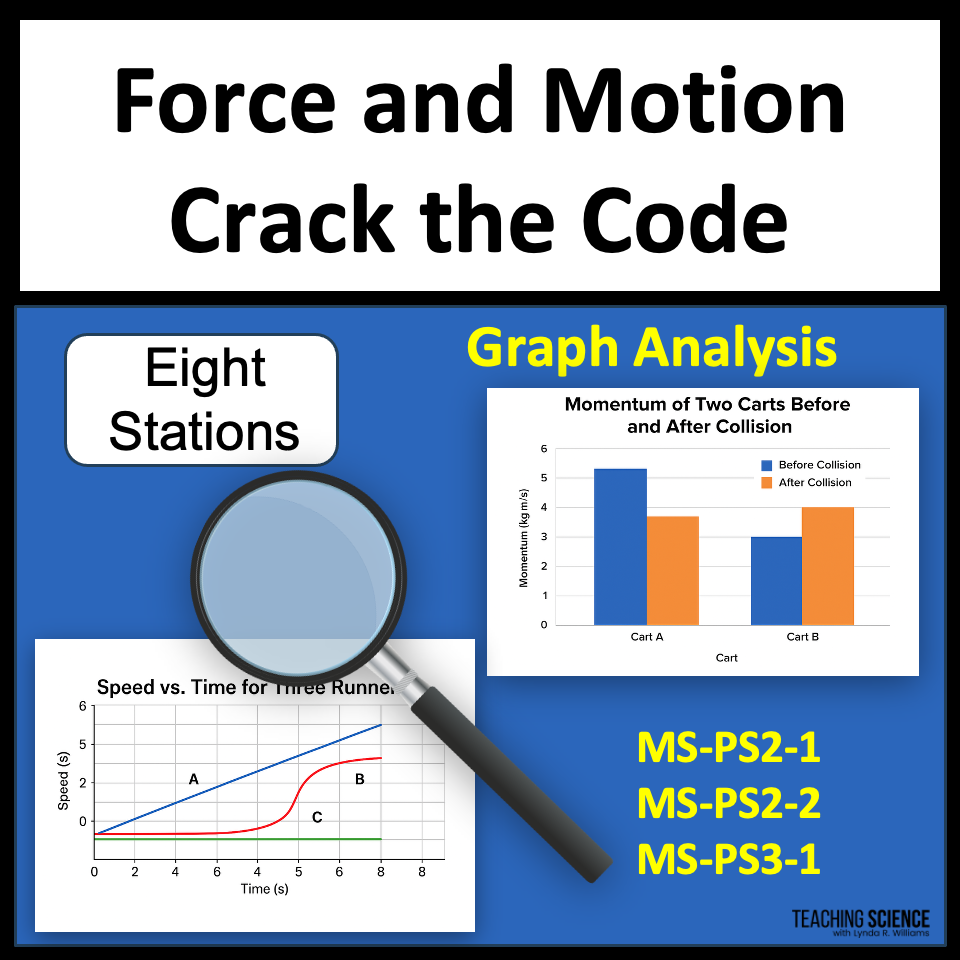
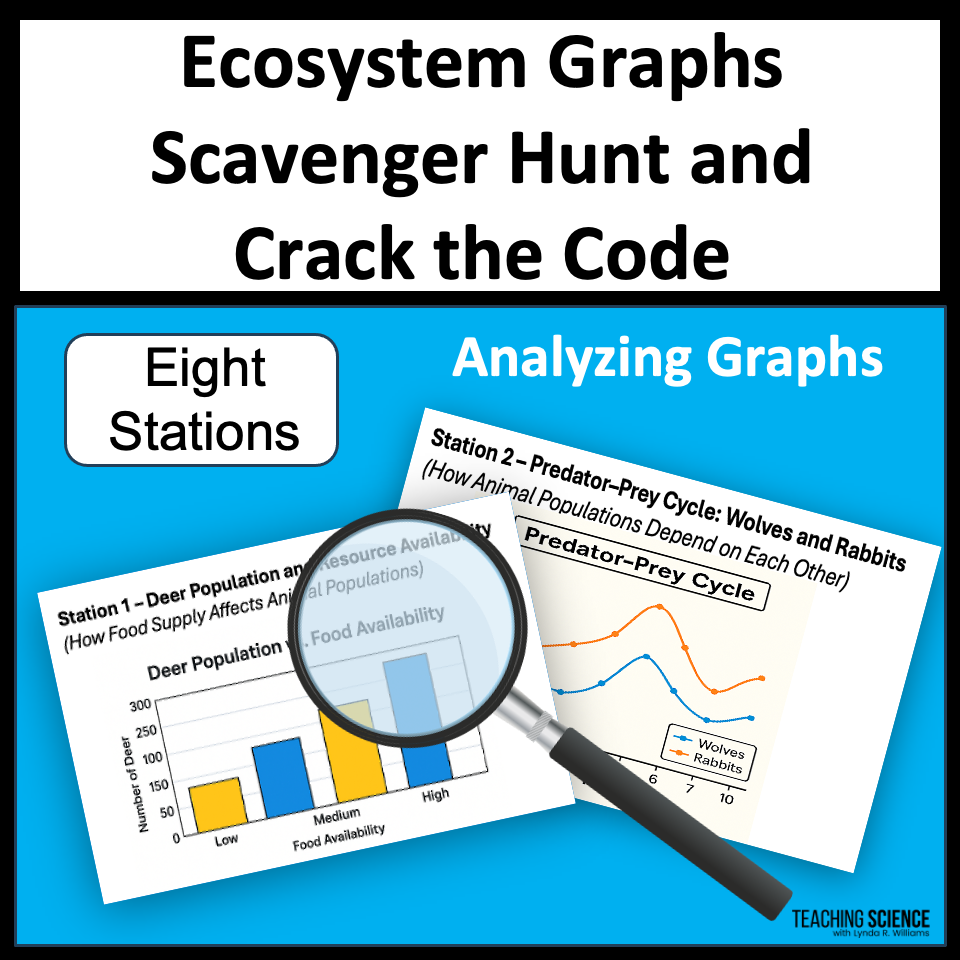
✅ Use ready-made graph activities from my CER Graph Analysis and Crack-the-Code Science Stations to connect data to real-world science topics like ecosystems, weather, and motion. Each graph includes guiding questions that help students make sense of the trends.
5. Teach Students to Explain Their Thinking
After reading a graph, students should practice explaining what they found. Claim-Evidence-Reasoning (CER) writing provides the perfect structure:
-
Claim: What pattern or relationship do you see?
-
Evidence: What data supports it?
-
Reasoning: Why does it make sense scientifically?
By combining CER and graphs, students move from guessing to justifying — a critical shift in scientific literacy.
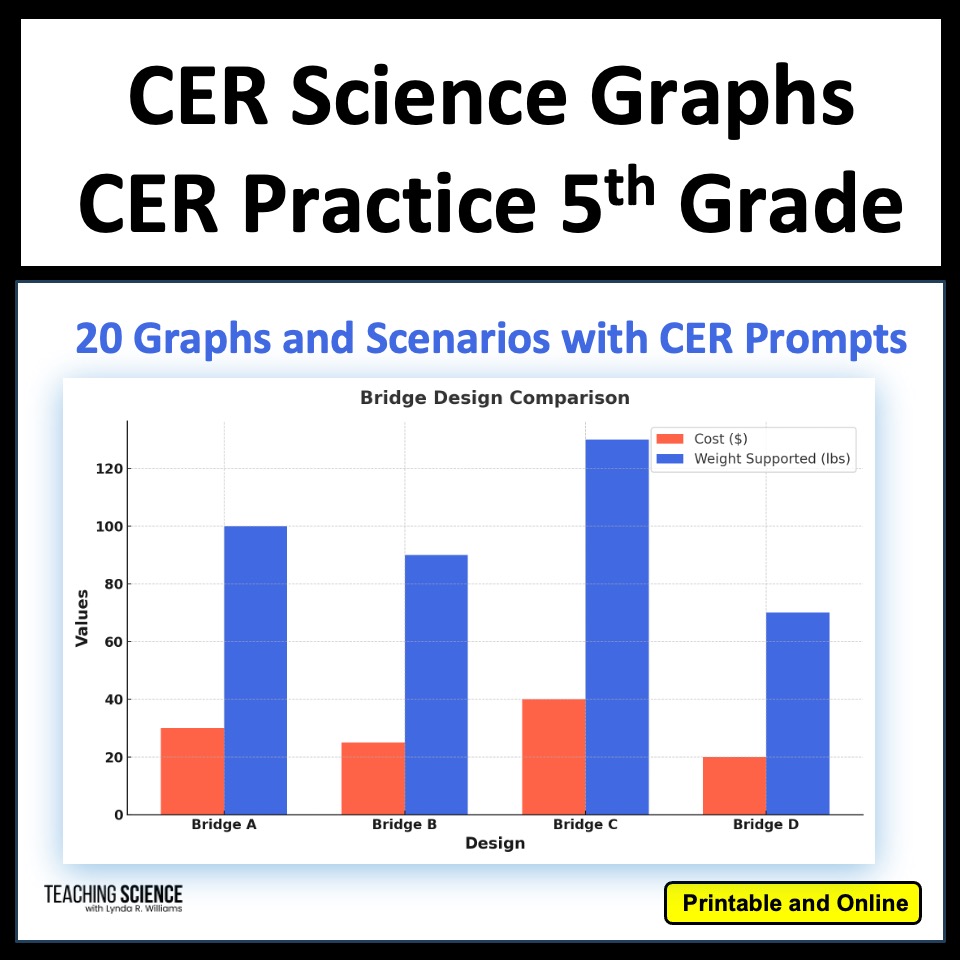
✍️ My CER + Graph Resources include scaffolded sentence frames and sample student responses to help even struggling learners write scientifically accurate explanations.
6. Provide Mixed-Format Assessments
Students need exposure to many data styles — bar graphs, line graphs, scatterplots, and tables. Include a variety of question types:
-
Multiple-choice
-
Short-answer explanations
-
“Which graph best represents…?” comparisons
This helps prepare students for state assessments like the NGSS-aligned tests, AzSci, and PSSA Science exams, which all rely heavily on graph interpretation.
7. Encourage Student Discussion
Talking about graphs improves understanding. Try quick pair-share routines:
-
“What does this graph show?”
-
“Do you agree with my interpretation?”
-
“What could cause this pattern?”
Peer discussion promotes reasoning and gives students confidence to defend their answers — key skills for scientific argumentation.
8. Make Data Analysis Fun and Engaging
Not every graph lesson needs to feel like a test!
Turn graph practice into puzzles, competitions, or decoding challenges.
🧩 My Science Crack-the-Code and Escape-Room Style Graph Activities combine data interpretation, critical thinking, and vocabulary in a format students love. They’ll analyze graphs, find code letters, and reveal secret words — all while practicing the same data skills tested on state exams.
Final Thoughts
I have planned the lesson for you. It includes a slide show, response pages, and a lesson plan.
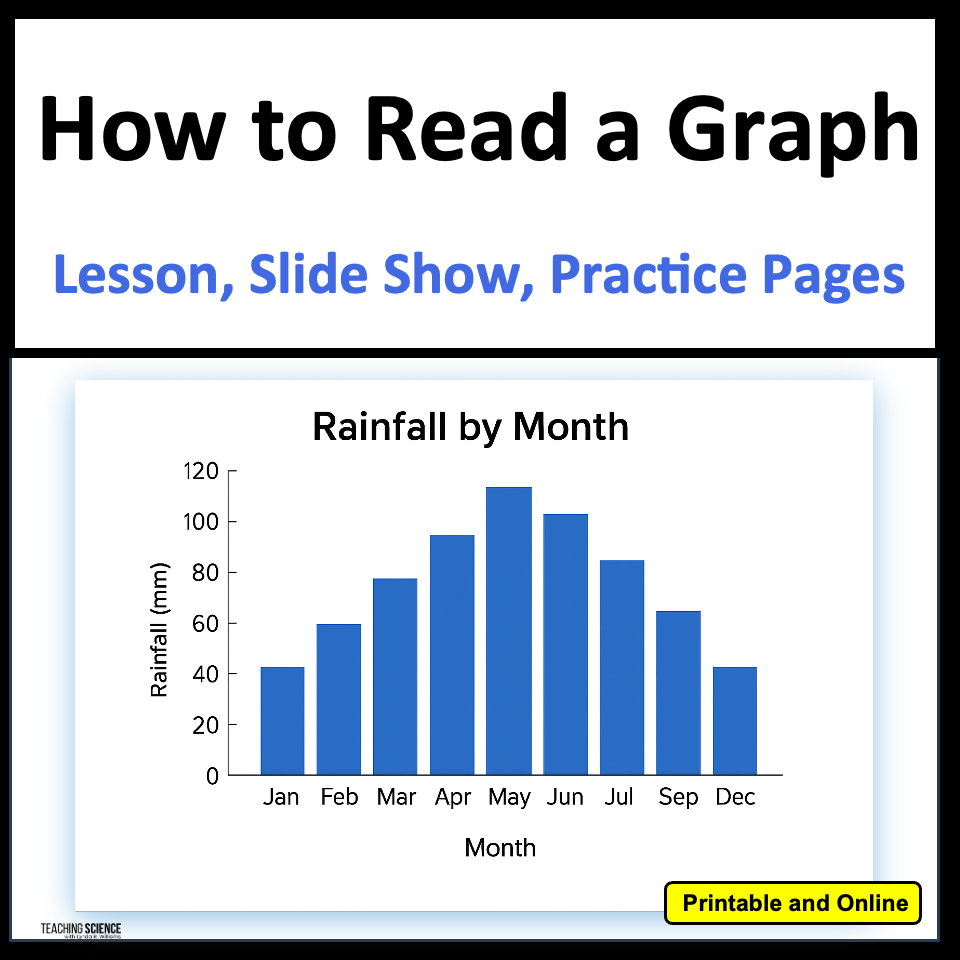
Teach Your Students How to Read a Graph
I have the whole thing planned for you and ready to use!
- Visualize – Look carefully at the graph type, title, and labels.
- Describe – Explain what changes, increases, or decreases. Identify Variables
- Explain – Use data evidence to support conclusions.
Teaching students to read graphs and data tables isn’t just a standard — it’s a life skill. With consistent practice, clear modeling, and engaging materials, students learn to extract meaning from data instead of feeling overwhelmed by it.
Whether you use a daily graph warm-up, CER writing activity, or a Crack-the-Code station, the goal is the same: helping students become confident data interpreters and science thinkers.
✨ Related Resources for Your Classroom
-
Daily Graph Bellringers – Middle School Science
-
CER Graph Analysis Activities
-
Force & Motion Code-Breaker Science Stations
-
Ecosystem Graph Analysis Pack


About the Author
Lynda R. Williams is an experienced science and STEM educator with more than 34 years in education. She holds a K–12 teaching license and a master’s degree in Curriculum and Instruction. Lynda has taught elementary students and future educators in university Science Methods courses.
She creates practical, standards-based resources that help upper-elementary and middle school teachers make science instruction engaging, meaningful, and manageable. Her areas of expertise include science phenomena, graph and data analysis, STEM engineering, inquiry-based learning, Claim-Evidence-Reasoning, NGSS, and Utah SEEd standards.
Lynda has presented her research on interactive notebooks at professional conferences, received multiple awards for her work, and was honored with a Faculty Excellence Award from Utah Valley University.
Learn more about Lynda R. Williams and her experience in science and STEM education.