Graph analysis is one of the most important skills fifth-grade students use in science. Students encounter graphs during investigations, labs, science readings, assessments, and Claim-Evidence-Reasoning activities. However, many students need direct instruction and repeated practice before they can confidently explain what scientific data shows.
Students may be able to locate the highest bar or read one point on a line graph, but analyzing data requires more. They need to identify variables, compare values, recognize patterns, describe relationships, and use evidence to support a conclusion.
A 5th grade science graph analysis boot camp gives students structured practice with these skills. Instead of expecting students to figure out unfamiliar graphs on their own, you can teach them a consistent process they can use throughout the entire school year.
What Is a 5th Grade Science Graph Analysis Boot Camp?
A 5th grade science graph analysis boot camp is a focused set of lessons and activities that teaches students how to read, interpret, and explain scientific data.
Students receive direct instruction in graph types and data-analysis skills before applying what they have learned to a variety of science graphs. They practice identifying important information, recognizing trends, comparing data, and drawing evidence-based conclusions.
The goal is not simply to complete a worksheet about one graph. The goal is to give students a repeatable process they can use during labs, investigations, CER writing, review, and science test preparation.
Why Is Graph Analysis Important in 5th Grade Science?
Graphs help scientists organize information and communicate patterns that may be difficult to recognize in a data table alone. Fifth-grade students must learn to make sense of those patterns.
During science instruction, students may be asked to:
- Compare plant growth under different conditions
- Analyze weather data collected over time
- Identify changes in animal populations
- Examine the effect of water availability on plants
- Compare the number of organisms found in different environments
- Use data to support a scientific claim
These tasks require students to do more than find a number. Students must understand what the data means and how it connects to the scientific question being investigated.
When students are comfortable analyzing graphs, they can focus more on the scientific concept rather than becoming overwhelmed by the data format.
Why Do Fifth Graders Struggle with Science Graphs?
Fifth-grade students often enter the classroom with very different graphing experiences. Some students can read simple bar graphs but struggle with line graphs or graphs containing more than one set of data. Others may focus on individual points without noticing the overall pattern.
Common difficulties include:
- Skipping the graph title
- Confusing the horizontal and vertical axes
- Ignoring labels, units, or scales
- Describing one data point instead of the overall trend
- Confusing the independent and dependent variables
- Making a claim without citing data
- Writing an observation that is not supported by the graph
These difficulties do not necessarily mean students do not understand the science. They may simply need the process of graph analysis to be taught explicitly.
Teach a Consistent Process for Interpreting Graphs in Science
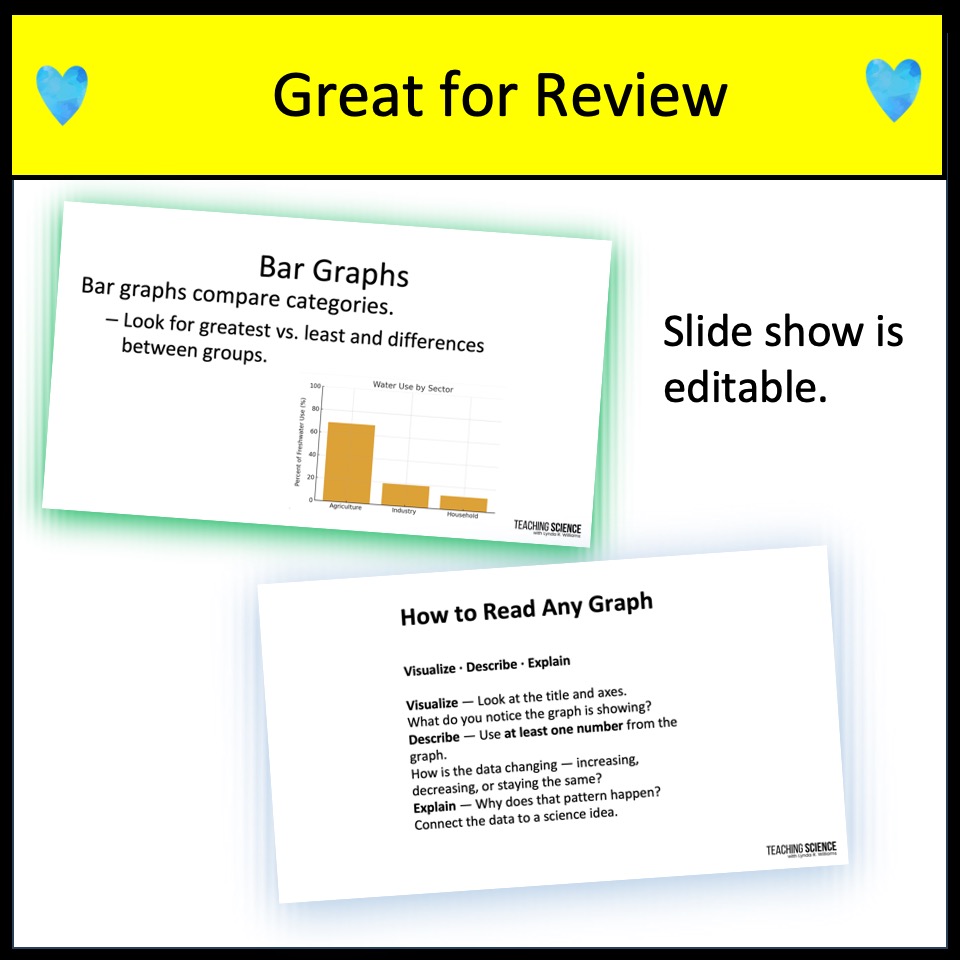
Students are more successful when they have a predictable routine to follow. Instead of approaching every graph as a completely new challenge, teach students to ask the same questions each time.
1. What is the graph about?
Students should begin by reading the title. The title provides the context they need to understand the data.
2. What variables are being compared?
Students should examine the labels on both axes and identify what was changed, observed, or measured.
3. What pattern does the data show?
Students may notice an increase, decrease, difference, similarity, cycle, or relationship between variables.
4. What evidence supports the conclusion?
Students should identify specific values or comparisons from the graph instead of making a general statement without evidence.
This process helps students slow down and examine the entire graph before answering questions.
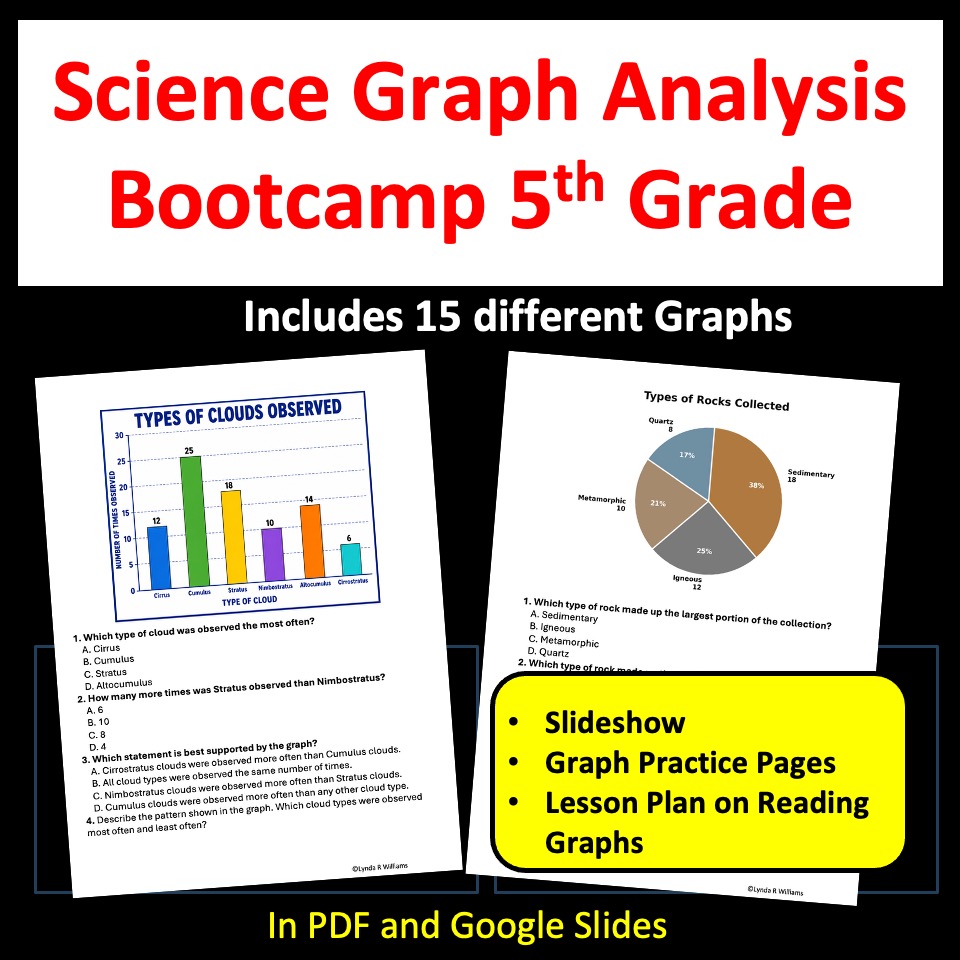
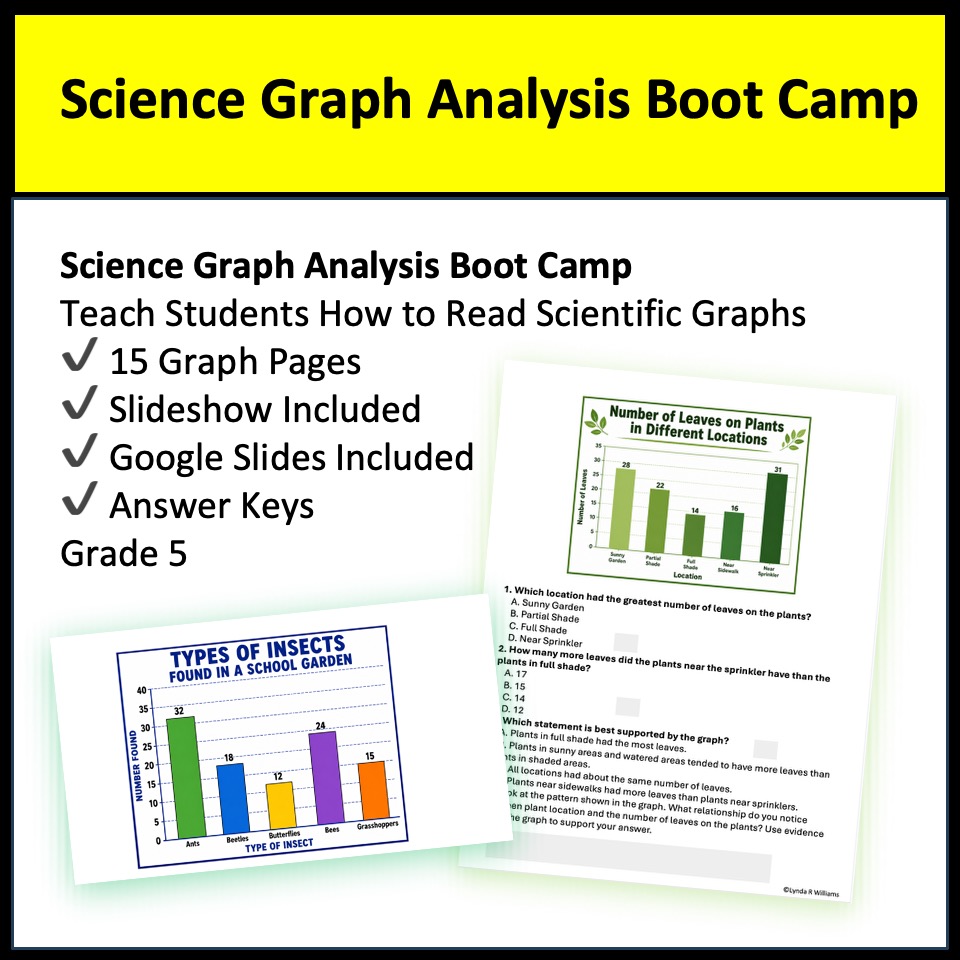
My 5th Grade Science Graph Analysis Boot Camp includes a teaching slideshow that introduces important graphing and data-analysis skills. Students then apply those skills to 15 science graph activities.
Use Realistic Fifth-Grade Science Data
Graph practice is more meaningful when students analyze data connected to science instead of working only with unrelated numbers.
The graph-analysis activities include fifth-grade-friendly topics such as:
- Plant growth
- Number of leaves on plants
- Bird sightings
- Weather conditions
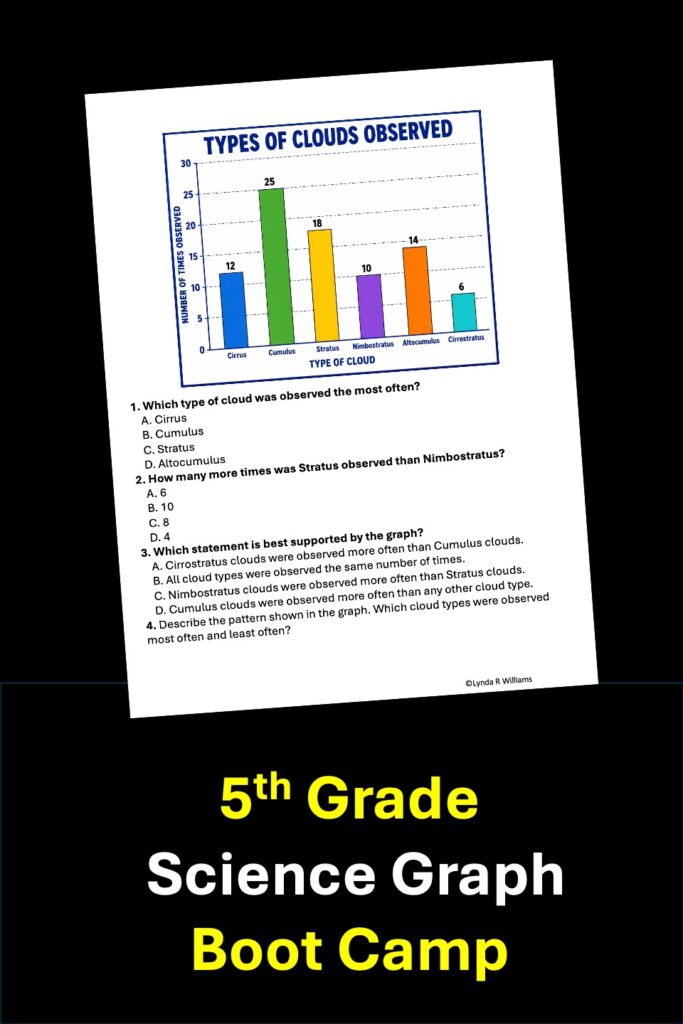
- Cloud observations
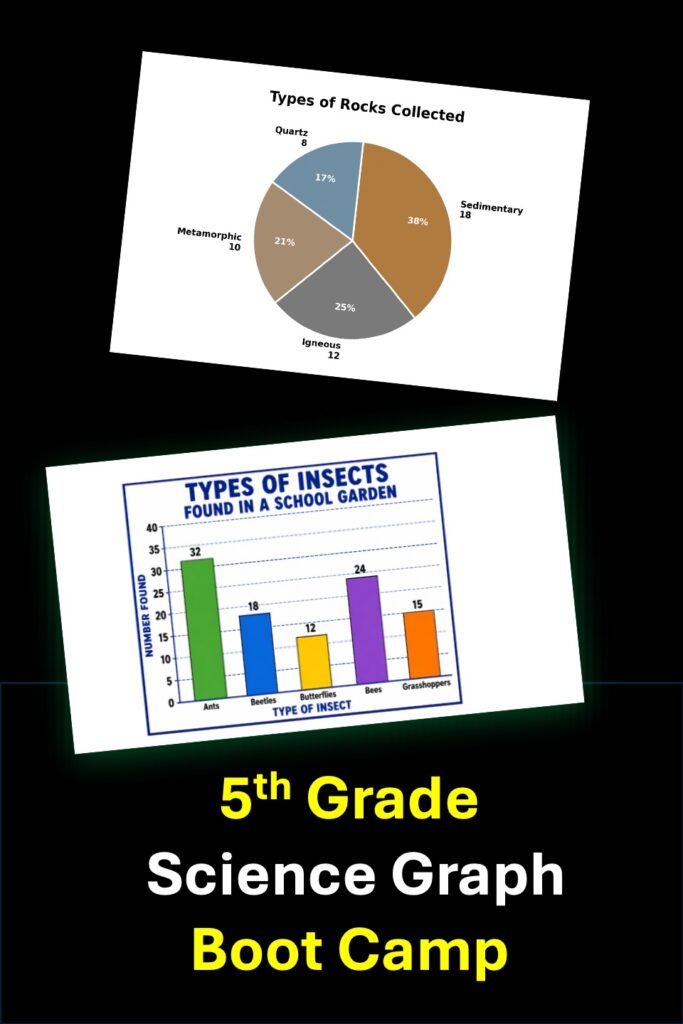
- Insects in a school garden
- Monthly rainfall
- Water availability and plant height
- Types of rocks collected
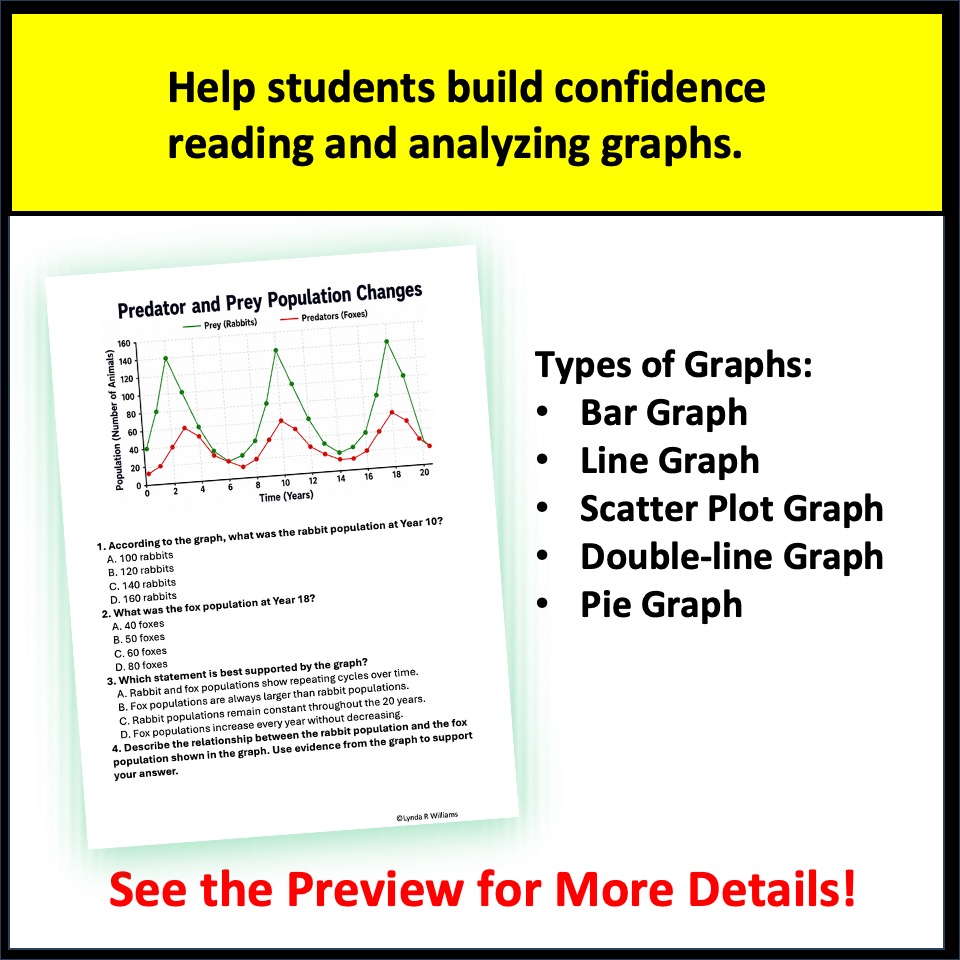
- Predator and prey populations
- Recycling collected
- Schoolyard biodiversity
- Screen time data
- Water consumption
These topics allow students to practice graph analysis while thinking about familiar life, Earth, physical, and environmental science concepts.
Because the activities cover a variety of topics, they can be used even when the class is not currently studying one specific unit.
Introduce Students to Different Types of Science Graphs
Students need practice interpreting more than one kind of graph. Different graph types are used to communicate different kinds of information.
The 5th grade science graphing activities include:
- Bar graphs
- Line graphs
- Pie charts
- Scatter plots
- Multi-line graphs
Bar graphs help students compare categories. Line graphs help them recognize changes over time. Pie charts show how categories make up a whole. Scatter plots help students examine possible relationships between variables. Multi-line graphs allow students to compare two or more sets of data.
Exposure to different graph types helps students become more flexible and confident when they encounter graphs during science instruction and assessments.
Connect Graph Analysis to Fifth-Grade Labs and Investigations
Students use graph-analysis skills before, during, and after scientific investigations.
Before a lab, students may analyze a sample graph to review variables and possible relationships. During an investigation, they collect and organize their own measurements. Afterward, they use the completed graph to determine what happened and whether the results support their hypothesis.
A student who understands how to analyze a graph is better prepared to answer questions such as:
- What pattern occurred in the results?
- Which condition produced the greatest change?
- How did one variable affect another?
- Was the hypothesis supported?
- What data can be used as evidence?
Teaching graph analysis before students complete major investigations can make the analysis portion of a lab much more productive.
Strengthen CER Writing with Graph Evidence
Graph analysis and Claim-Evidence-Reasoning writing work naturally together.
When students write a CER response, the graph can provide the evidence they need. However, students must be able to identify the most relevant data before they can use it effectively.
For example, students may make a claim that plants receiving more water grew taller. Their evidence should include specific measurements from the graph. Their reasoning should then explain how the evidence supports the claim.
Regular graph-analysis practice helps students move from vague statements such as “The plant grew more” to evidence-based explanations that include actual data.
This makes graph analysis useful not only as a stand-alone science skill but also as preparation for stronger scientific writing.
Use 5th Grade Science Graph Analysis Throughout the Year
Although a science boot camp works well near the beginning of the year, the activities are not limited to back-to-school instruction.
Introduce Graphing and Data Skills
Use the teaching slideshow and several activities before beginning your first major science investigation.
Prepare Students for a Lab
Select a graph activity that reviews the type of relationship students will examine during an upcoming investigation.
Use Activities as Science Warm-Ups
Assign one graph or a few questions at a time as bell ringers. Short, repeated practice keeps data-analysis skills fresh.
Add Graphs to Science Centers
Place individual activities at a science station for independent or partner practice.
Support Small-Group Intervention
Work through a graph with students who need additional instruction. Model how to examine the title, labels, units, scale, and patterns.
Review Before an Assessment
Use the activities to review graph types, variables, patterns, and evidence before a unit test or state science assessment.
Provide Independent Practice
Students can complete activities independently after you have modeled the analysis process.
Because the resource includes a teaching slideshow, lesson plan, student practice pages, and answer key, you can use it as a complete sequence or select individual activities as needed.
What Is Included in the 5th Grade Science Graph Analysis Boot Camp?
The complete resource includes:
- 15 science graph-analysis activities
- A teaching slideshow
- A lesson plan
- Student practice pages
- Multiple-choice and short-answer questions
- An answer key
- Five different graph types
- More than 60 pages and slides
The activities are no prep and can be used for whole-class instruction, centers, warm-ups, intervention, review, independent practice, or test preparation.
Explore the 5th Grade Science Graph Analysis Boot Camp.
Build a Complete Foundation of Fifth-Grade Science Skills
Graph analysis is an essential skill, but it is only one part of helping students become confident science learners.
Students also need to understand lab safety, science tools, scientific investigations, variables, teamwork, and evidence-based writing.
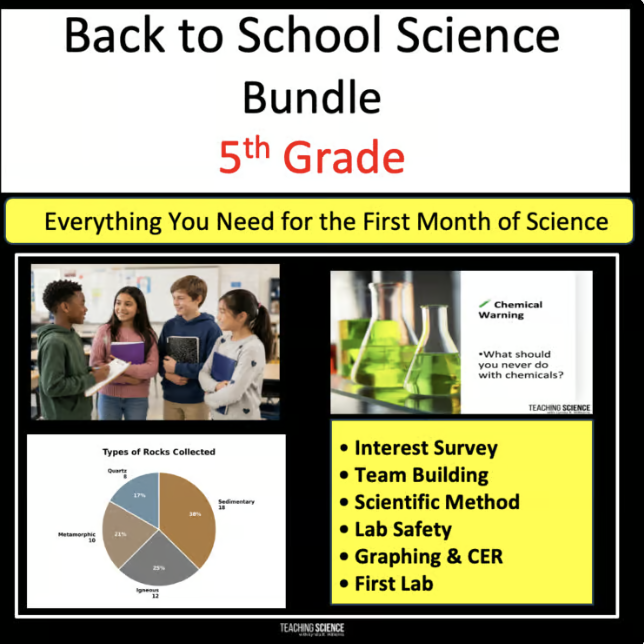
The Graph Analysis Boot Camp is also included in my Back-to-School 5th Grade Science Activities Bundle. The bundle brings together ready-to-use activities for graph analysis, lab safety, science tools, the scientific method, variables, CER writing, team building, science phenomena, and a first science investigation.
The bundle is a helpful option for teachers who want a more complete collection of foundational science activities. However, the individual Graph Analysis Boot Camp can be used independently at any point during the school year.
Frequently Asked Questions About 5th Grade Science Graph Analysis
What graphing skills should fifth-grade students know?
Fifth-grade students should be able to read graph titles, identify variables, interpret labels and scales, compare values, recognize patterns, and draw conclusions supported by data.
What types of graphs should fifth graders be able to interpret?
Students should have experience with bar graphs, line graphs, and pie charts. They can also begin working with scatter plots and multi-line graphs when the data and questions are presented at an appropriate level.
How do you teach graph analysis in science?
Begin by modeling a consistent process. Teach students to examine the title, identify the variables, read the labels and units, describe the pattern, and cite specific evidence. Then provide guided and independent practice.
How does graph analysis support science investigations?
Students use graphs to organize results, recognize relationships between variables, evaluate hypotheses, and draw conclusions from the data collected during an investigation.
How can graphs be used in CER writing?
A graph can provide evidence for a scientific claim. Students should cite specific values or comparisons from the graph and explain how that evidence supports their claim.
Can these graph activities be used for science test preparation?
Yes. The activities give students practice with several graph types, realistic science data, multiple-choice questions, and short-answer responses. They can be used throughout the year or before science assessments.
Is the Graph Analysis Boot Camp only for the beginning of the school year?
No. It can be used at any time for direct instruction, lab preparation, warm-ups, centers, intervention, review, CER practice, independent work, or test preparation.
Help Fifth Graders Become Confident with Scientific Data
Students need more than occasional exposure to graphs. They need direct instruction, a consistent analysis process, and repeated opportunities to interpret scientific data.
A 5th grade science graph analysis boot camp helps students move beyond simply locating numbers. Students learn to recognize patterns, compare results, draw conclusions, and support their ideas with evidence.
These skills will help them during labs, investigations, CER writing, classroom assessments, and science test preparation throughout the year.
See the complete 5th Grade Science Graph Analysis Boot Camp.
For a broader collection of foundational fifth-grade science lessons and activities, view the Back-to-School 5th Grade Science Activities Bundle.
You might also like Back to School Phenomena Bell Ringers