Reading a graph may look like a simple skill, but many middle school students need explicit instruction and repeated practice before they can confidently interpret scientific data. Students may be able to identify the highest bar or locate a point on a line graph, yet still struggle to explain the relationship between variables, recognize a trend, or support a conclusion with evidence.
A middle school science graph-analysis boot camp provides students with a structured way to learn these skills. By teaching graph vocabulary, variables, graph types, patterns, and evidence-based explanations step by step, you can help students become more independent when working with data in every science unit.
What Is a Middle School Science Graph Analysis Boot Camp?
A middle school science graph analysis boot camp is a focused series of lessons and activities that teaches students how to read, interpret, and explain scientific graphs. Students receive direct instruction and then practice analyzing different types of graphs using data from life, Earth, physical, and environmental science.
The goal is not simply to help students answer questions about one graph. It is to give them a repeatable process they can use whenever they encounter scientific data.
Why Do Middle School Students Struggle with Science Graphs?
Students enter middle school with very different levels of graphing experience. Some can identify basic parts of a graph but struggle to go beyond surface-level observations. Others confuse the independent and dependent variables or describe individual data points without recognizing the overall pattern.
Students may struggle to identify variables, interpret scales and units, compare data sets, recognize trends, or explain what the data means in a scientific context. These difficulties affect more than one graphing lesson. Students need data-analysis skills during investigations, CER writing, classroom assessments, and state science tests.
When students’ graph analysis skills are weak, they may understand the scientific concept but still struggle to demonstrate their understanding.
Teach Students a Consistent Process for Analyzing Graphs
One of the best ways to improve graph analysis is to establish a consistent routine for students. Instead of approaching every graph as a completely new task, students can learn to ask the same basic questions each time:
- What variables are being studied?
- What does the graph show?
- What patterns or relationships are visible?
- What evidence supports the conclusion?
A predictable framework reduces guesswork. It also encourages students to study the title, axes, labels, units, key, and scale before jumping to an answer.
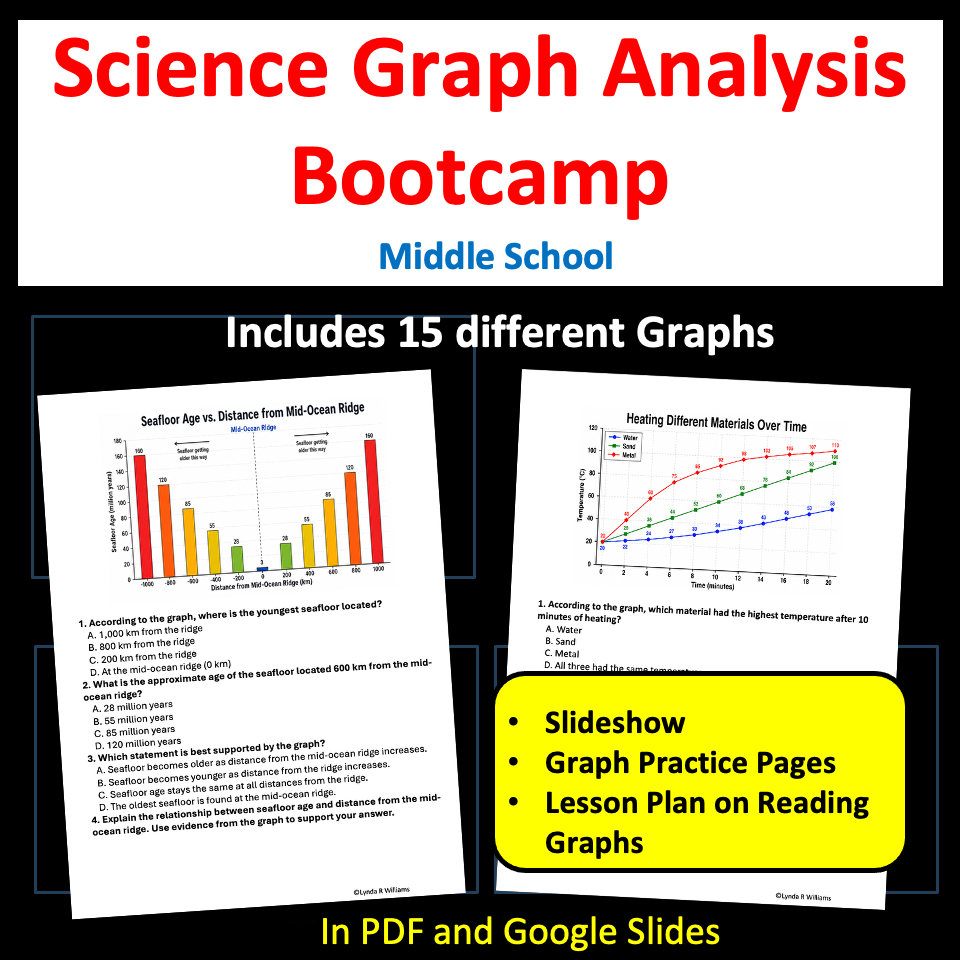
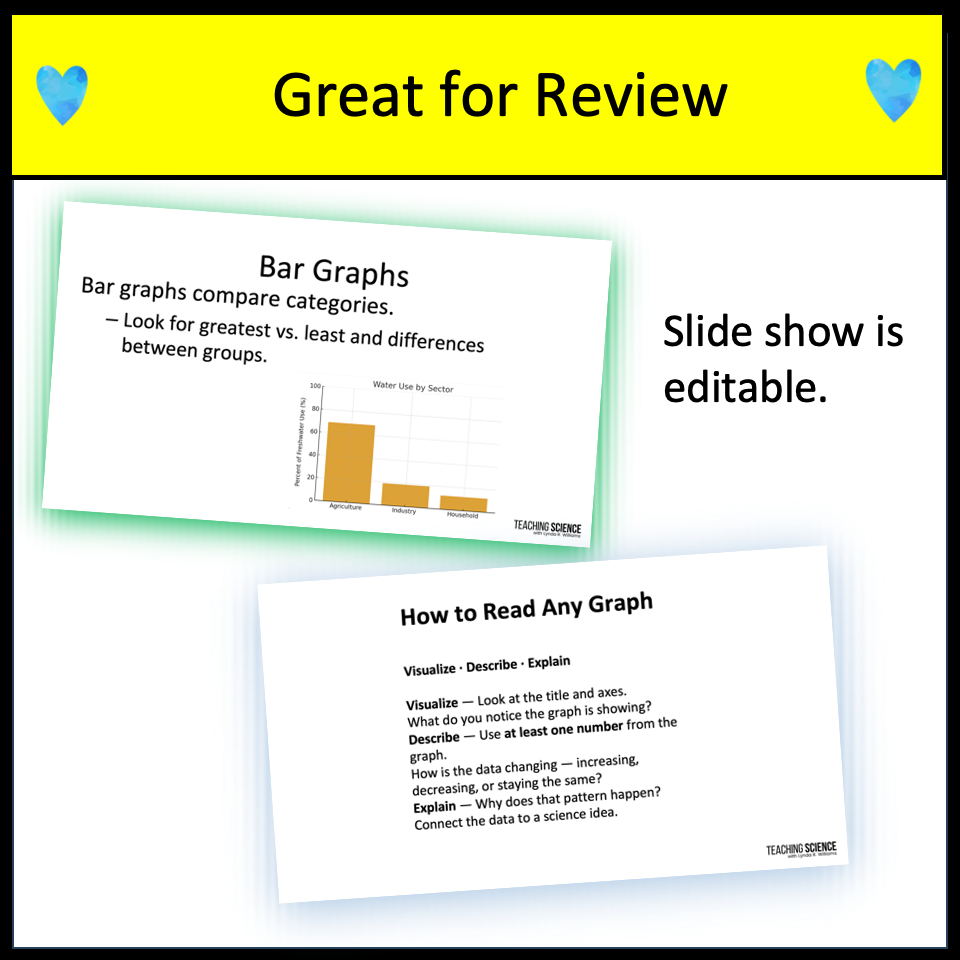
My Middle School Science Graph Analysis Boot Camp begins with an instructional slideshow that introduces graph vocabulary, graph types, variables, trends, and a simple four-question analysis framework. Students then apply the process to 15 science graph-analysis activities.
Use Real Science Topics to Make Graph Practice Meaningful
Graphing practice is more useful when students are analyzing data that looks and feels like science. A page filled with unrelated numbers may help students locate values, but it does not always help them understand how scientists use data to explain real-world patterns.
The activities include topics from across the middle school curriculum, such as:
- Earthquake frequency by magnitude
- Bacterial growth over time
- Monthly rainfall by biome
- Speed versus time
- Light intensity versus distance
- Force versus acceleration
- Water availability and plant height
- Sound volume versus distance
- Solubility and water temperature
- Seafloor age and distance from a mid-ocean ridge
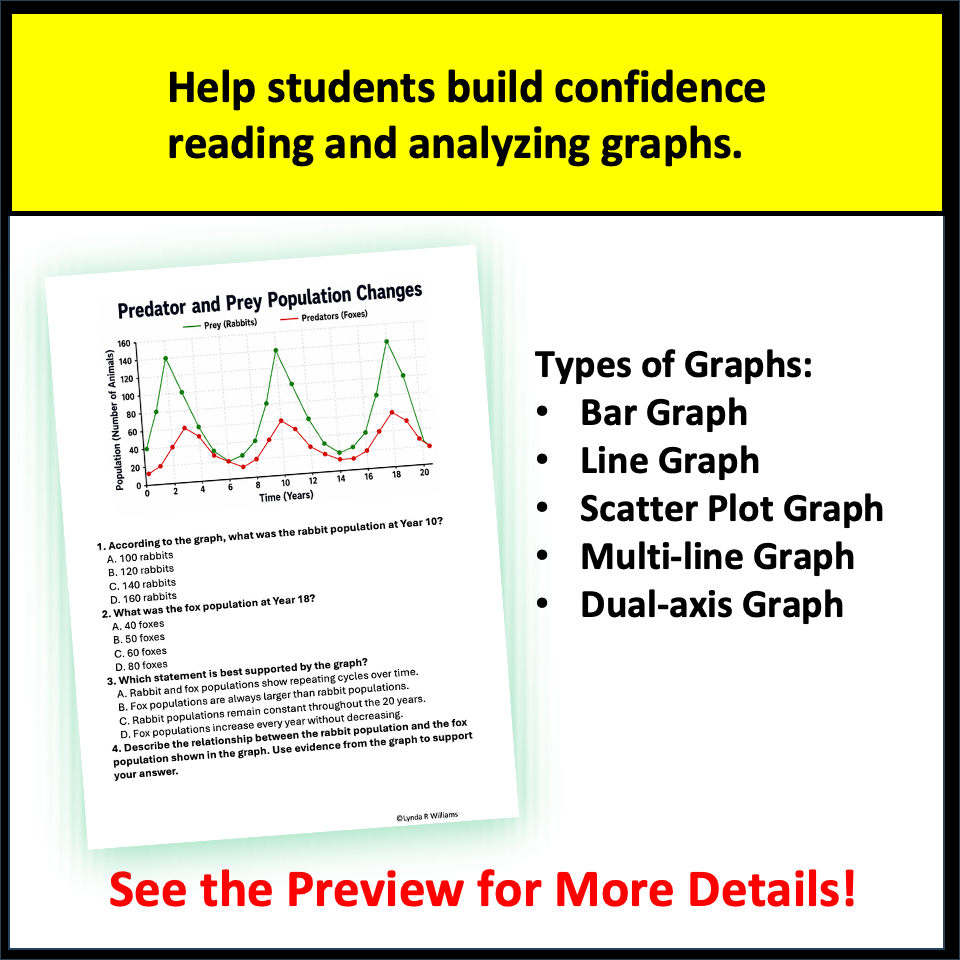
- Predator and prey population changes
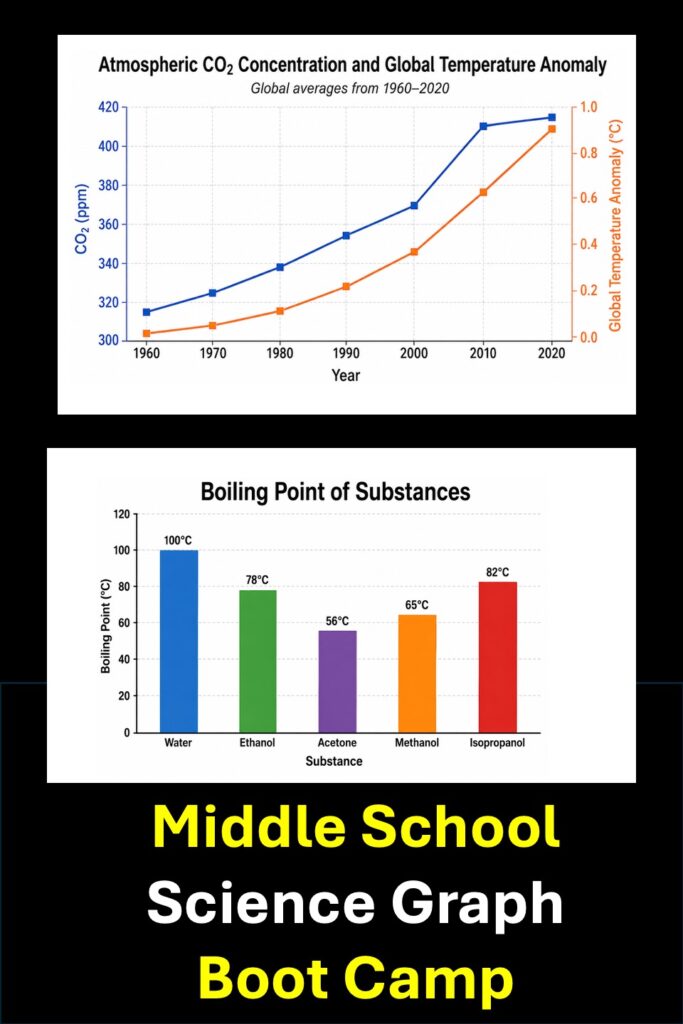
- Atmospheric carbon dioxide and global temperature change
Because the topics span several science domains, students learn that data analysis is not limited to one unit. The same thinking skills apply whether they are studying ecosystems, forces, weather, waves, microorganisms, or Earth science.
Practice Multiple Types of Scientific Graphs
Students need experience with more than basic bar and line graphs. As they move through middle school, they encounter graphs that display multiple variables, compare data sets, or show relationships that are not immediately obvious.
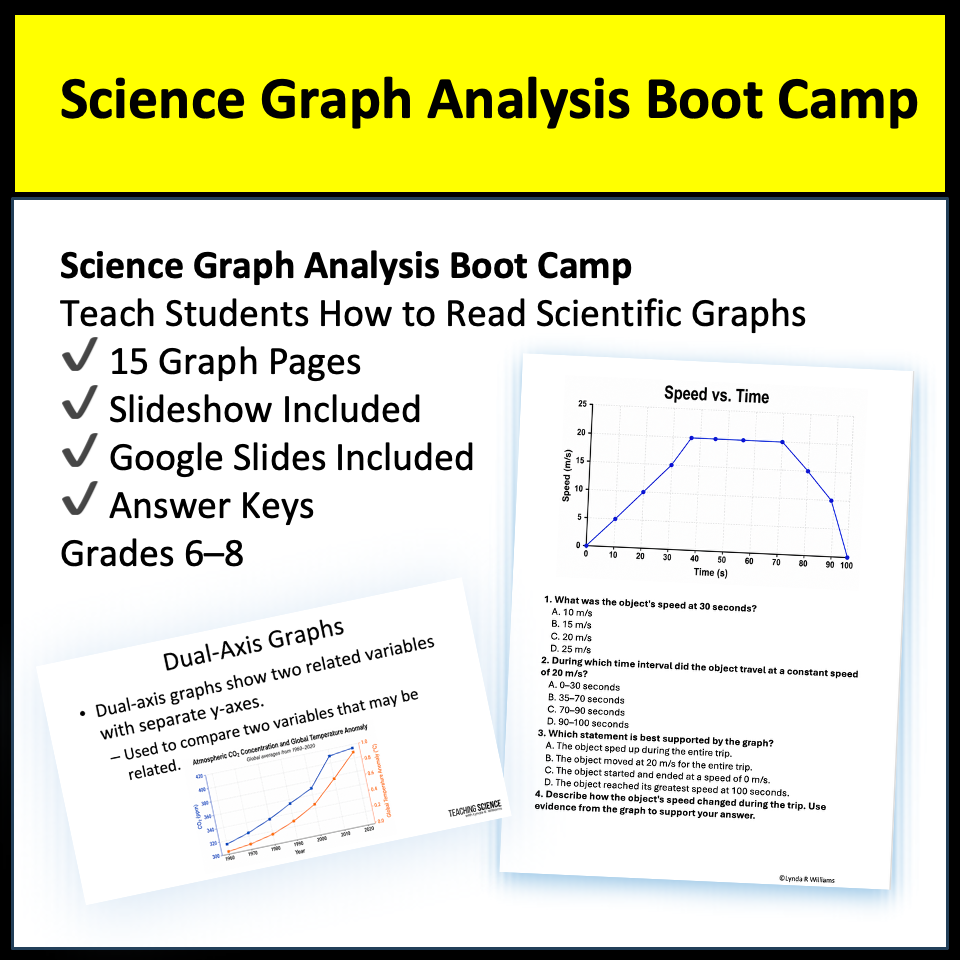
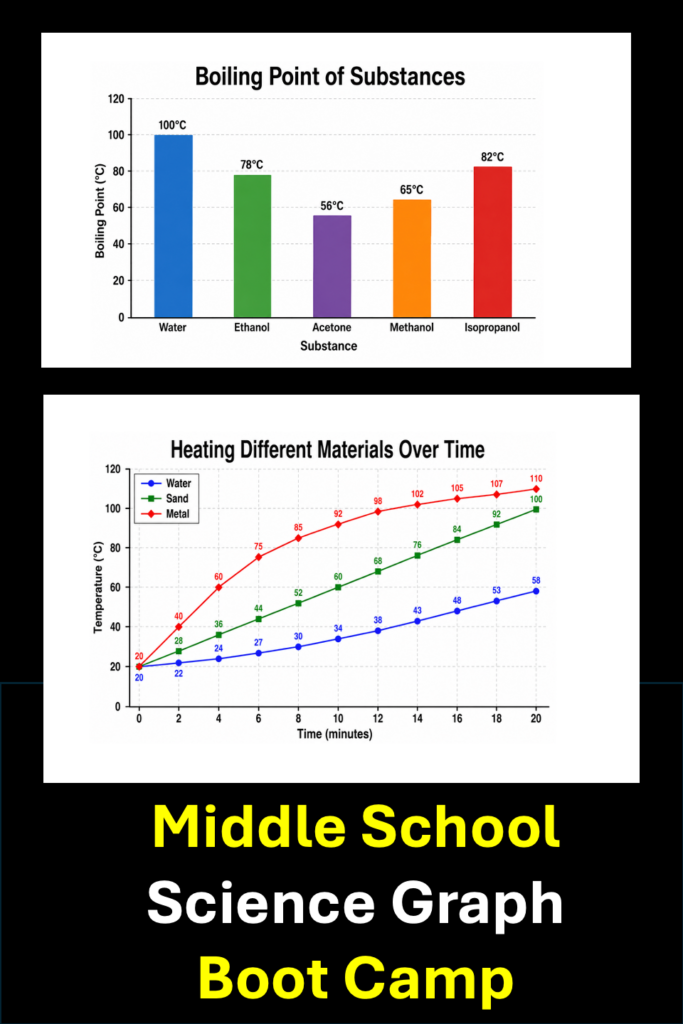
This science graphing resource includes practice with bar graphs, line graphs, scatter plots, multi-line graphs, and dual-axis graphs. The variety helps students become more flexible thinkers and creates opportunities to discuss why a scientist might choose one graph format instead of another.
Move Students from Reading Data to Explaining Data
Finding a number on a graph is only the beginning. In science, students must interpret the data and communicate what it means.
Strong graph-analysis questions ask students to describe trends, compare data sets, identify relationships, make predictions, and support conclusions with specific values. This practice also prepares students for lab analysis and Claim-Evidence-Reasoning writing.
How Can You Use Science Graph Analysis Activities All Year?
Although graph analysis is an excellent skill to teach at the beginning of the school year, it should not disappear after the first few weeks.
Introduce Essential Science Skills
Use the instructional slideshow and initial activities before students begin their first major investigation. This establishes shared vocabulary and expectations for analyzing data.
Review Before a Lab
Choose a graph that connects to the type of relationship students will investigate. A short review reminds students to identify variables, examine patterns, and use evidence before analyzing their own results.
Use as Bell Ringers or Spiral Review
Assign one graph or a few questions at a time as warm-ups. Short, repeated practice helps students maintain their skills without requiring a full lesson period.
Support Intervention Groups
Students who struggle with data interpretation often benefit from guided small-group practice. Model your thinking, discuss the graph step by step, and gradually release responsibility.
Prepare for Science Assessments
Use the activities for unit review, test preparation, or practice with constructed responses. Students can revisit graph types and relationships from several science domains.
The resource includes printable pages and Google Slides, so it can also be used for stations, independent work, absent students, homework, or digital learning.
What Is Included in the Science Graph Analysis Boot Camp?
The complete resource is designed for grades 6–8 and includes:
- An instructional slideshow
- A detailed lesson plan
- 15 graph-analysis activities
- A graph-types reference page
- Answer keys
- Printable PDF pages
- A Google Slides version
The activities can be taught as a focused unit, spread across several weeks, or selected individually to match your current science content.
See the complete Middle School Science Graph Analysis Boot Camp.
Build a Complete Foundation of Middle School Science Skills
Graph analysis is one part of a larger set of skills students need in science. They must also understand variables, follow lab-safety procedures, collect data, collaborate, and support claims with evidence.
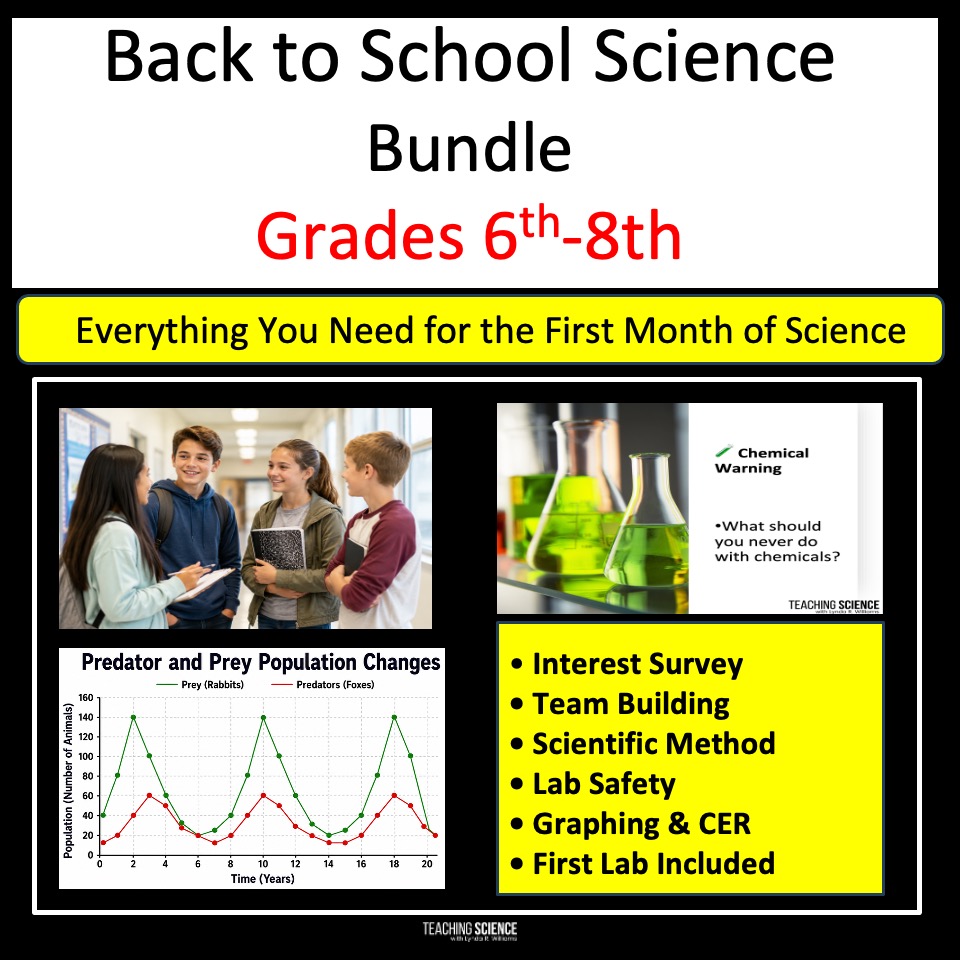
The Science Graph Analysis Boot Camp is also included in my Back-to-School Middle School Science Bundle. The bundle combines graph analysis with science-interest activities, team building, nature of science, the scientific method, variables, lab safety, a first lab investigation, CER writing, fall data-analysis activities, and phenomena bell ringers.
Frequently Asked Questions About Middle School Science Graph Analysis
What graphing skills should middle school students know?
Students should be able to identify variables, read titles and axes, interpret scales and units, recognize patterns, compare data sets, describe relationships, and support conclusions with evidence.
How do you teach students to analyze a science graph?
Model a consistent process. Ask students to identify the variables, determine what the graph shows, describe the pattern, and cite specific evidence. Provide guided practice before expecting independent analysis.
What types of graphs are used in middle school science?
Students commonly work with bar graphs, line graphs, scatter plots, multi-line graphs, and dual-axis graphs. Each format communicates a different type of relationship or comparison.
How often should students practice graph analysis?
Students benefit from short, repeated practice throughout the year. Include graph analysis in bell ringers, labs, CER activities, unit reviews, intervention, and test preparation.
Is This Resource Only for Back to School?
No. It can be used at any point in the year for direct instruction, review, intervention, bell ringers, lab preparation, independent practice, or science test prep.
Give Students the Tools to Make Sense of Scientific Data
Students cannot develop confidence with graphs if they only encounter them occasionally or are expected to figure them out on their own. Explicit instruction, a consistent analysis process, and repeated practice make scientific data much more manageable.
A middle school science graph analysis boot camp helps students move beyond simply reading values. They learn to recognize relationships, select evidence, explain patterns, and communicate conclusions—skills they will use in every area of science.
Explore the Middle School Science Graph Analysis Boot Camp.
For a complete collection of ready-to-use lessons that builds science skills, routines, and confidence, view the Back-to-School Middle School Science Bundle.
Teach students How to Read a Graph